2026-08-11
MayRetire is a retirement planning application for Canadians. It helps you model retirement cash flow, withdrawals, taxes, portfolio evolution, and estate outcomes for single or couple plans.
This draft reflects the latest sections documented from current app screens and source behavior.
? icons for contextual help on fields and
panels.+ / - controls or type values
directly.
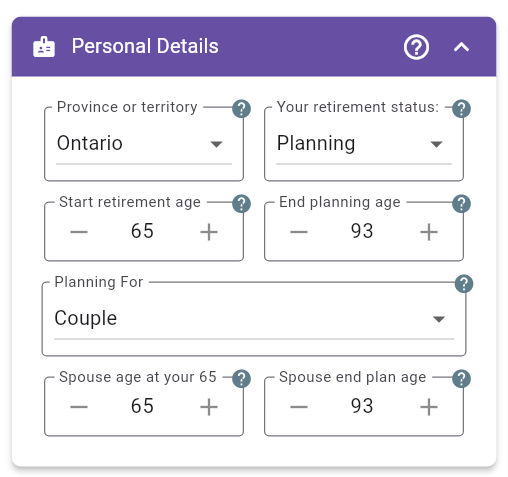
Figure 1: Personal Details - Planning
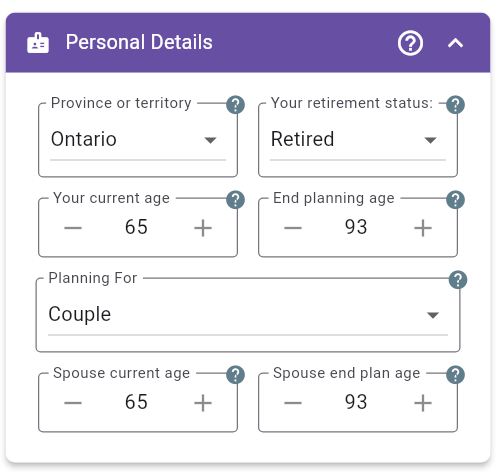
Figure 2: Personal Details - Retired
This panel establishes the timeline and household context for the entire model. Age inputs here affect pension start logic, tax modeling, survivorship projections, and how many years your assets must support spending.
Province or territory Select your current province or territory of residence. MayRetire applies province-specific tax brackets and credits to all annual calculations.
Your retirement status (Planning or
Retired) Use Planning when retirement
has not started yet. Use Retired when it has already
started. This switch changes several fields from projected values to
current values so the model starts from the right baseline.
Start retirement age (Planning mode) The age at which retirement cash-flow modeling begins.
Your current age (Retired mode) Your age at current year-end. This helps MayRetire position your plan correctly on the timeline and apply age-triggered rules immediately.
End planning age The final age in the projection horizon. A longer horizon usually lowers apparent plan safety unless assets/spending assumptions are adjusted.
Planning For (Single or
Couple) Chooses one-person or two-person household
planning. Couple mode enables spouse timelines and tax-sharing logic
used throughout the plan.
Spouse age at your retirement age (Planning + Couple) Spouse age in the year your retirement starts. This aligns partner timelines correctly for benefits and tax treatment.
Spouse current age (Retired + Couple) Spouse age at current year-end for in-retirement couple modeling.
Spouse end plan age (Couple) Final projection age for spouse. Important for longevity and survivor-risk analysis.
Practical guidance:
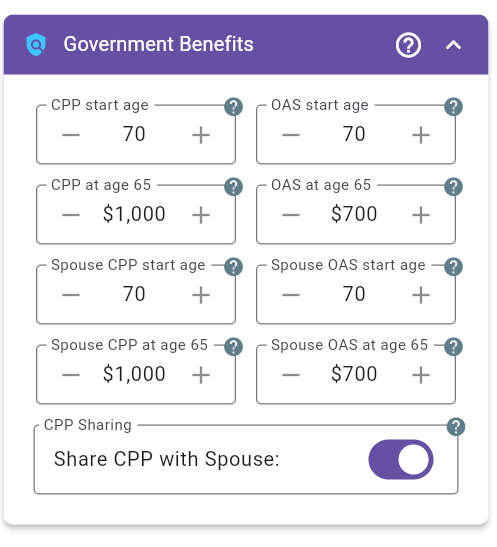
Figure 3: Government Benefits - Planning
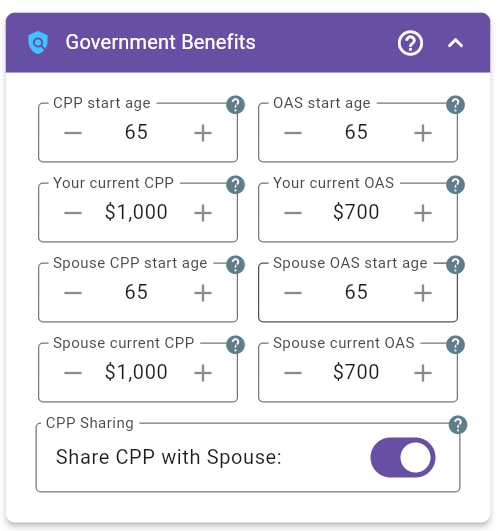
Figure 4: Government Benefits - Retired (CPP/OAS started)
This panel configures guaranteed government income from CPP/QPP and OAS for both partners (if applicable). These settings strongly influence required withdrawals, taxes, and long-run sustainability.
In couple mode, the left column is for you and the right column is for your spouse, with matching benefit fields aligned on the same row. In single mode, each applicable field expands to the full panel width.
CPP start age Choose the age CPP/QPP starts (typically 60 to 70). Starting earlier reduces monthly income; delaying increases monthly income.
OAS start age Choose OAS start age (typically 65 to 70). Deferral increases monthly OAS.
CPP amount (Planning-style input) Enter
your projected monthly CPP/QPP amount and then choose
Estimation at: 65 | 70 | Start. Use 65 if the
amount is your estimated monthly CPP at age 65. Use 70 if
the amount is your estimated monthly CPP at age 70. Use
Start if the amount is your estimated monthly CPP at the
age you plan to start CPP. MayRetire converts this input into the
correct CPP amount for both age 65 and your selected CPP start
age.
OAS at age 65 (Planning-style input) Enter projected monthly OAS at age 65. MayRetire applies start-age adjustment.
Your current CPP / Your current OAS (Retired and already started) If benefits are already active, enter your current monthly payments instead of age-65 estimates.
Spouse CPP/OAS fields (Couple mode) Use
the same logic for spouse: start ages plus projected amounts (planning)
or current amounts (retired-started). For spouse CPP,
Estimation at: Start means the estimated monthly CPP at the
start of your spouse’s CPP.
CPP Sharing Enabling CPP sharing does not change total household CPP. It changes taxable attribution between spouses and can improve tax efficiency.
Practical guidance:
Additional Income entry. It
will be taxed as regular income to the CPP recipient.When at least one CPP/QPP or OAS start age can still be changed, the Government Benefits panel shows an Explore Benefits Timing link. Select it to compare the valid start-age combinations without manually changing and recalculating the plan one age at a time.
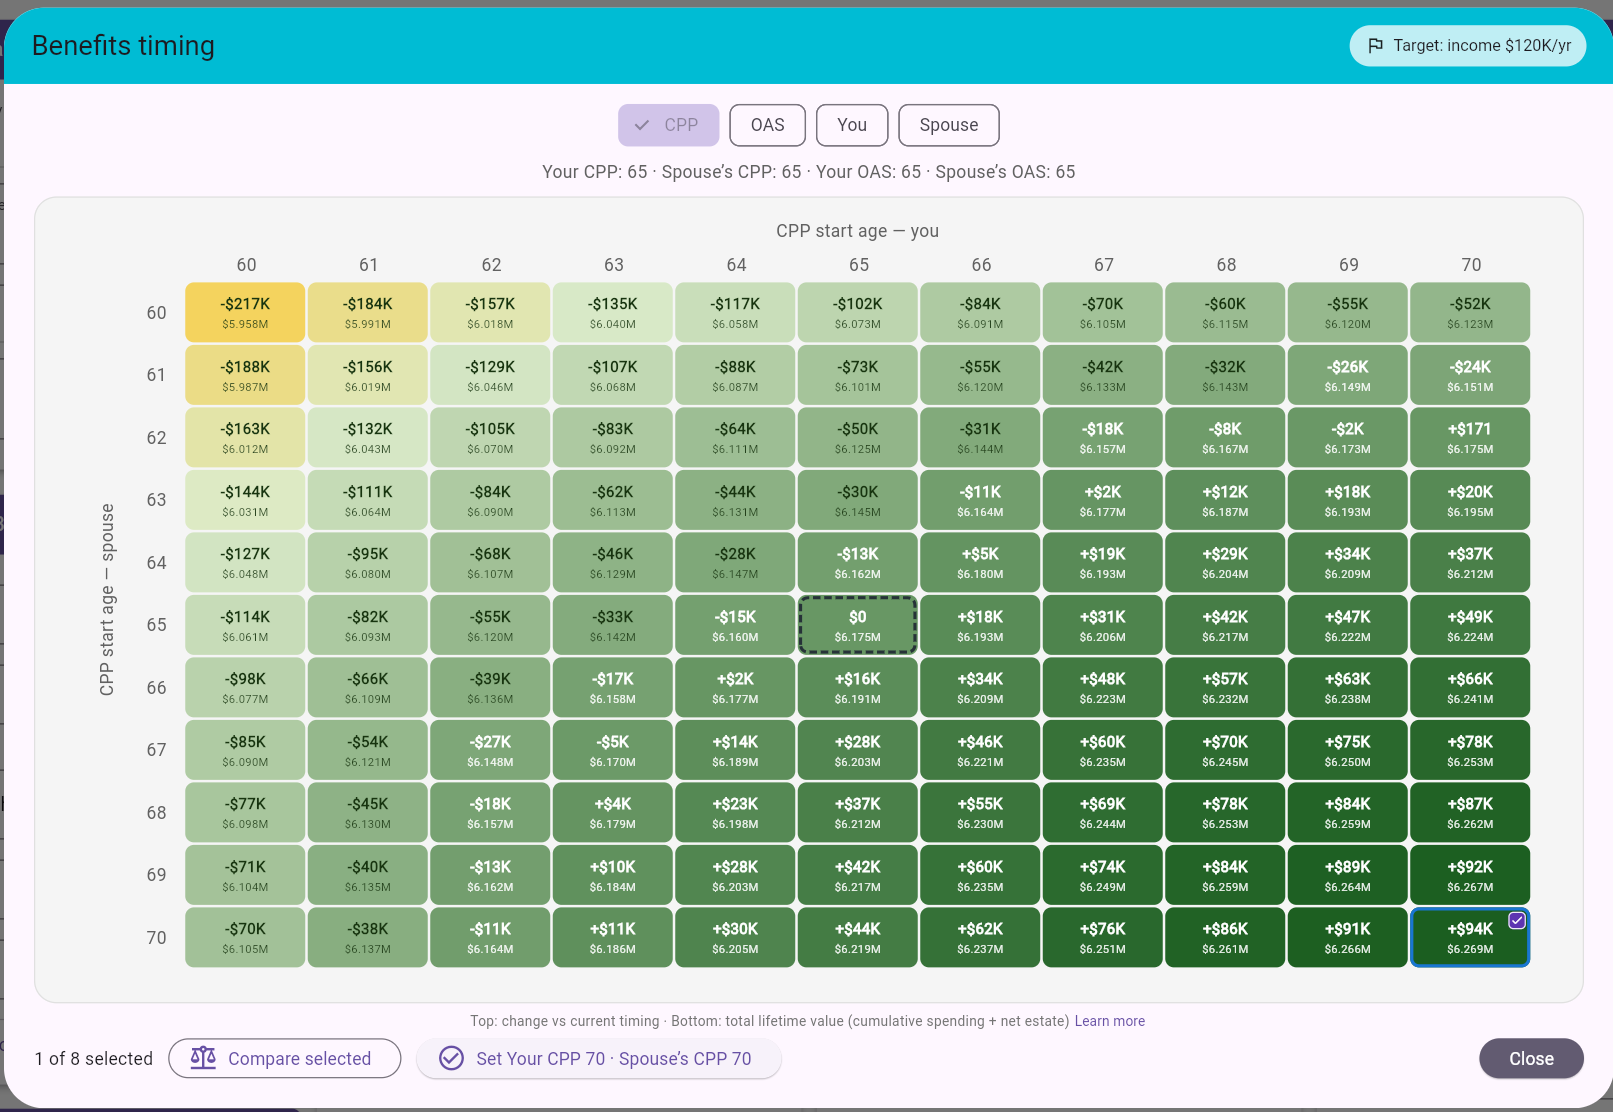
Figure 5: Explore Benefits Timing dialog
The target badge in the upper-right corner identifies the income or estate objective used to determine whether each result succeeds. The buttons above the chart control which benefit ages are evaluated:
Only applicable choices are shown. A benefit that has already started is not varied. When only one age remains variable, the heatmap becomes a single row or column while retaining the fixed benefit age on the other axis. Single-person plans do not need mode buttons and show CPP/QPP against OAS directly.
Each heatmap cell represents one timing combination:
Successful results use a yellow-to-green value scale, with darker green generally indicating greater total lifetime value. Peach cells miss the selected income or estate target. A dashed border marks the current timing, a solid blue border marks the best result, and a checkmark marks a selected cell.
You can select up to eight cells and choose Compare selected to inspect them in the plan-comparison dialog. When exactly one selected cell differs from the current plan, a Set button identifies the age or ages that will change. Confirming the change keeps the Benefits Timing dialog open, updates the current timing reference, and lets you continue exploring another mode. The changed timing is applied to the main plan when you close the dialog.
If a CPP/QPP estimate uses Estimation at: Start,
MayRetire also adjusts the estimated monthly CPP/QPP payment when
applying a different start age. Benefits that have already started are
never changed.
Practical guidance:
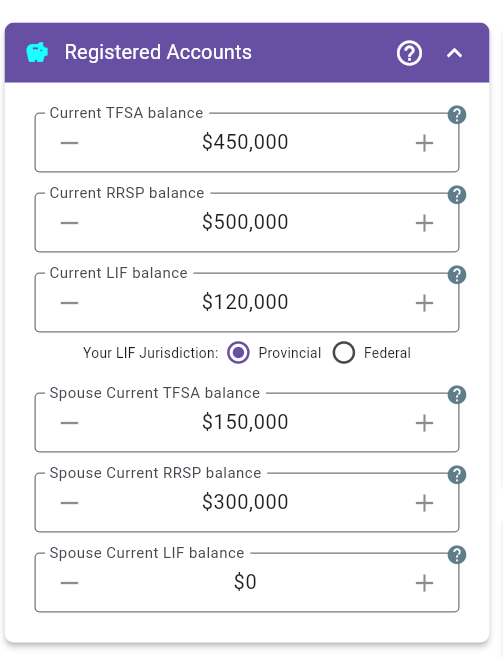
Figure 6: Registered Accounts - Retired Couple
This panel captures registered balances used to fund retirement in a tax-efficient way.
TFSA balance In planning mode, enter expected balance at retirement start. In retired mode, enter current balance. TFSA withdrawals are generally tax-free and often used for late-stage tax control.
RRSP balance In planning mode, enter projected RRSP at retirement start. In retired mode, enter current RRSP/RRIF balance. RRSP/RRIF withdrawals are taxable and central to drawdown-tax planning.
LIF / LIRA balance MayRetire shows LIF or LIRA based on age/status. LIRA is modeled as locked-in pension assets. Upon retirement or age 55 (whichever is later), MayRetire models conversion to LIF and applies legislated withdrawal limits.
LIF Jurisdiction (Provincial / Federal) Set governing regime for LIF calculations. This affects annual minimum/maximum withdrawal limits.
Gradual LIF Unlocking When available for the selected LIF jurisdiction, this option models an annual direct transfer of unused LIF maximum withdrawal room into an RRSP/RRIF. The transferred amount is treated as tax-deferred movement from locked-in funds to unlocked registered funds, not as spendable current-year cash and not as taxable LIF withdrawal income in the projection. In couple mode, the option applies to both partners where each person’s LIF jurisdiction supports the strategy.
Spouse TFSA / RRSP / LIF (or LIRA) (Couple mode) Enter spouse balances separately so MayRetire can optimize household withdrawals and taxation.
Practical guidance:
Note:
help_info.dart; wording above follows the app’s
LIF/LIRA modeling behavior.
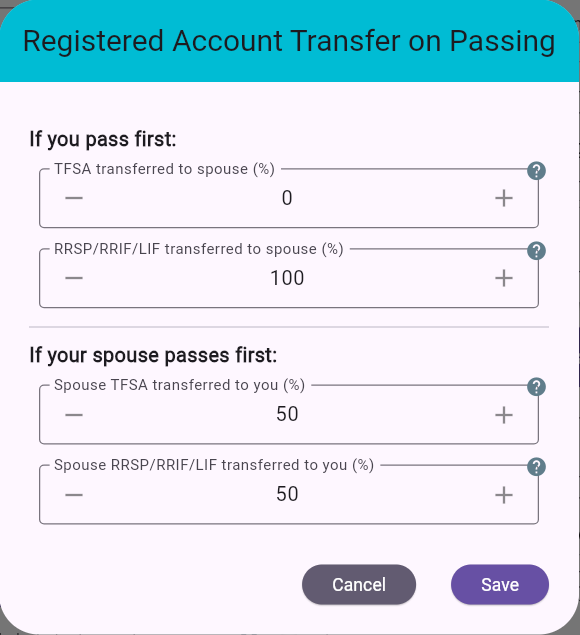
Figure 7: Registered Account Transfers On Passing
For couple plans, MayRetire assumes by default that 100% of TFSA and registered retirement accounts transfer to the surviving spouse on passing.
Use Edit at the bottom of the Registered Accounts panel only when part of those accounts is expected to go to someone outside the retirement plan.
TFSA transferred to survivor Set the percentage of TFSA assets transferred to the surviving spouse if that person passes first.
RRSP/RRIF/LIF transferred to survivor Set the percentage of RRSP/RRIF/LIF assets transferred to the surviving spouse if that person passes first. The remaining portion is treated as not transferring to the survivor.
Separate settings are available for your passing first and spouse passing first.
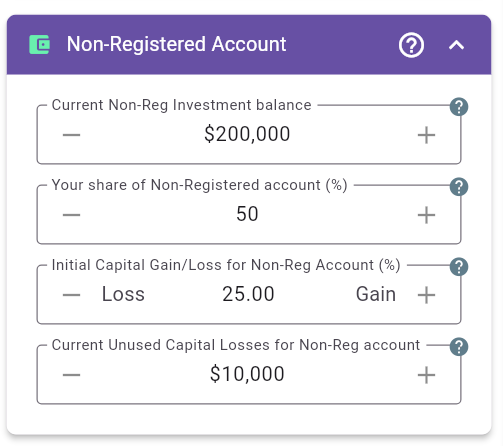
Figure 8: Non-Registered Account
This panel models taxable investment assets and their embedded tax profile.
Current Non-Reg Investment balance Enter total non-registered balance (or projected retirement-start balance in planning mode).
Your share of Non-Registered account (%)
(Couple mode) Defines tax attribution split between spouses.
Example: 50 means income and gains are attributed
50/50.
Adjusted Cost Base Enter the adjusted cost base (ACB) of the regular non-registered account. ACB is generally the amount originally invested, adjusted for purchases, sales, reinvested distributions, return of capital, and other tax cost-base adjustments. MayRetire compares the account balance with ACB to estimate embedded capital gains or losses. This drives capital-gain tax when non-registered capital is withdrawn or deemed disposed. Example: if the non-registered account balance is $250,000 and its ACB is $200,000, MayRetire treats the account as having an unrealized capital gain of $50,000. If the account balance is $90,000 and its ACB is $100,000, MayRetire treats it as having an unrealized capital loss of $10,000.
Current Unused Capital Losses for Non-Reg account Enter your carry-forward capital losses that can offset future realized capital gains, reducing projected tax.
Spouse Current Unused Capital Losses for Non-Reg account (Couple mode) Enter spouse carry-forward capital losses. MayRetire tracks unused capital losses separately because capital gains and losses are attributed to each spouse for tax purposes.
Practical guidance:
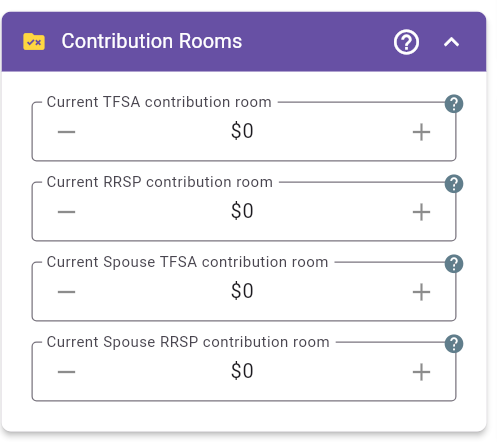
Figure 9: Contribution Rooms
This panel defines how much additional tax-sheltered contribution capacity is available.
Current TFSA contribution room Enter current available TFSA room. MayRetire increases TFSA room annually using the government limit assumption.
Current RRSP contribution room Enter RRSP room from your latest CRA Notice of Assessment. RRSP contributions are modeled as age-limited (through age 71).
Current Spouse TFSA contribution room (Couple mode) Same logic for spouse TFSA room.
Current Spouse RRSP contribution room (Couple mode) Same logic for spouse RRSP room, including age-71 contribution limit.
Practical guidance:
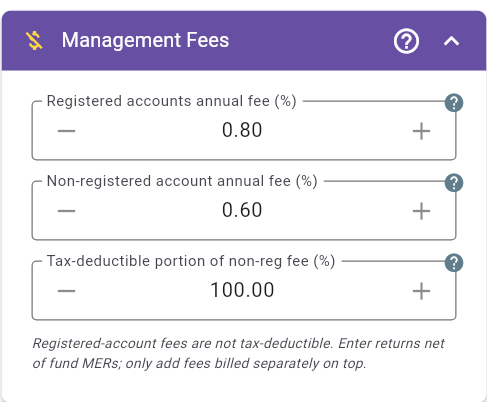
Figure 10: Management Fees for registered and non-registered accounts
This panel models annual investment costs for the regular registered and non-registered accounts. Fees for separately tracked Investment Portfolios are configured within each portfolio instead.
Registered accounts annual fee (%) Enter the annual percentage cost applied to TFSA, RRSP/RRIF, and LIF/LIRA balances. A single rate applies across the registered accounts, so use a reasonable balance-weighted average when the underlying investments have different fees. Registered-account fees reduce account balances but are not tax-deductible.
Non-registered account annual fee (%) Enter the annual percentage cost applied to the regular non-registered account. The cost can represent embedded fund expenses such as management expense ratios (MERs), separately billed management or advisory fees, or a combination of these costs. If the account contains investments with different fees, use a reasonable balance-weighted average.
Tax-deductible portion of non-reg fee (%) This
field appears when the non-registered fee is greater than zero. Enter
only the portion eligible for a personal tax deduction. In couple plans,
MayRetire allocates the deduction using the ownership share of the
regular non-registered account. Use 0% for an embedded ETF
or mutual-fund MER because that expense is reflected within the fund
rather than claimed separately on the investor’s tax return. For
separately billed fees, exclude non-deductible components such as
financial-planning services.
Investment costs can be reflected either in the expected return or as a separate Management Fee. Both approaches can produce a reasonable long-term projection, but the same cost must not be included twice.
| Situation | Return assumption | Management Fee input | Tax-deductible portion |
|---|---|---|---|
| Published ETF or fund return already reflects its MER | Use the net return | Do not enter the MER again | 0% |
| Gross return or FP Canada asset-class return | Use the before-fee return | Enter the applicable MER or other fee | 0% for an embedded MER |
| Separately billed eligible fee for a non-registered account | Use a return before that fee | Enter the billed rate | Enter only the eligible percentage |
| Fee applied to registered accounts | Use a return before that fee | Enter the applicable rate | Not deductible |
Using the separate Management Fee input is generally clearer when the return assumption is before fees. It shows the cost explicitly in results and allows MayRetire to apply eligible non-registered deductions. If a separately billed deductible fee is absorbed into a net return instead, its tax deduction cannot be modeled.
Account-level fees are percentage-based. Fixed-dollar fees are available only for individual Investment Portfolios.
Management Fee column group, hidden by default, with only
the relevant non-zero columns included.
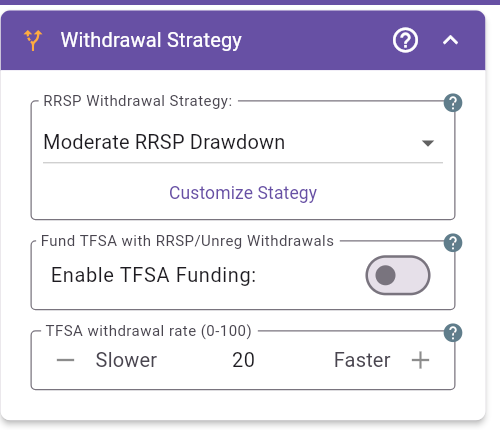
Figure 11: Withdrawal Strategy - Preset
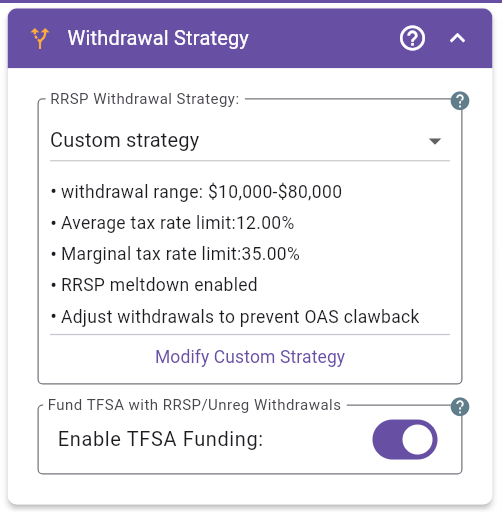
Figure 12: Withdrawal Strategy - Custom Summary
This panel controls account drawdown behavior and tax constraints across RRSP/RRIF, non-registered assets, and TFSA.
RRSP Withdrawal Strategy Choose a predefined
style (Conservative, Moderate,
Progressive, Accelerated) or define a
Custom strategy.
Preset mode Applies a ready profile to speed up scenario testing.
Custom mode Displays your active custom constraints (for example: amount limits, tax limits, meltdown, OAS-clawback adjustment).
Customize Strategy / Modify Custom Strategy Opens the full strategy editor.
Fund TFSA with RRSP/Unreg Withdrawals When enabled, MayRetire may withdraw beyond immediate spending needs to use TFSA room. TFSA can become a destination account for tax-efficient repositioning.
TFSA withdrawal rate (0 to 100) (shown when TFSA funding is disabled) Controls the share of remaining shortfall covered from TFSA. Example: if remaining shortfall is $10,000 and rate is 20, TFSA contributes about $2,000 before fallback rules apply.
Practical guidance:
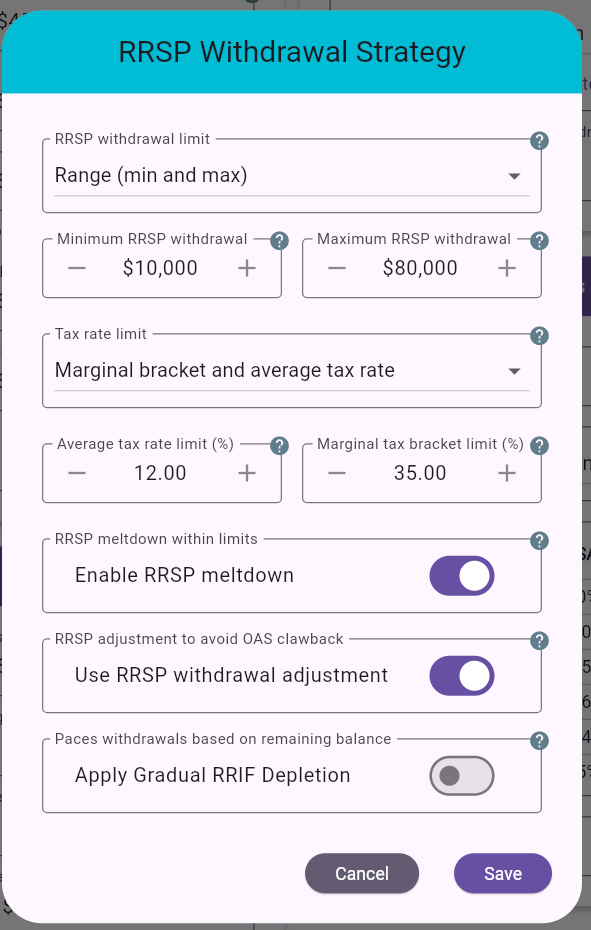
Figure 13: RRSP Withdrawal Strategy Dialog
Use this dialog to define annual withdrawal limits and tax targeting behavior.
RRSP withdrawal limit Options include range, min-only, max-only, fixed amount, or no amount limit.
Minimum RRSP withdrawal / Maximum RRSP withdrawal Used when floor/ceiling control is enabled.
Tax rate limit Choose tax control mode:
Average tax rate limit (%) Best-effort ceiling for average effective tax burden.
Marginal tax bracket limit (%) Best-effort ceiling for marginal tax on the next withdrawal dollar.
Enable RRSP meltdown Allows RRSP withdrawals above required income (within limits), often to reduce future tax concentration. Excess can be redirected to TFSA (if room exists) or non-registered account.
Use RRSP withdrawal adjustment (avoid OAS clawback) Reduces RRSP withdrawals where possible to lower OAS clawback while respecting mandatory minima.
Apply Gradual RRIF Depletion Adds a minimum pace intended to avoid very large end-of-plan RRIF balances and associated estate-tax spikes.
Conditional options you may also encounter Bridging before CPP/OAS, fixed-amount override behavior, RRSP tax-cost limit, and other mode-specific controls.
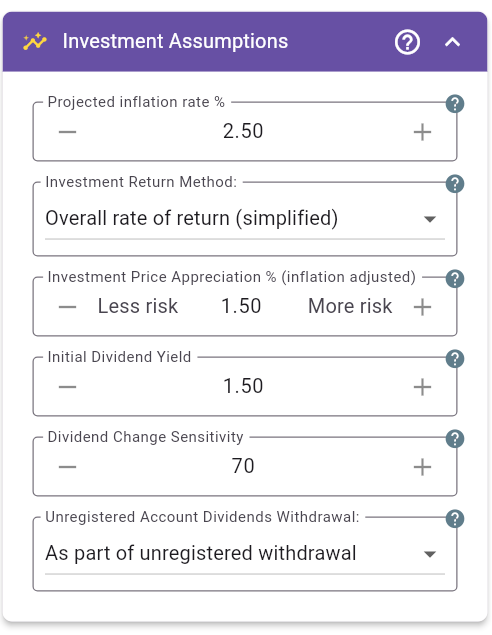
Figure 14: Investment Assumptions - Simplified Method
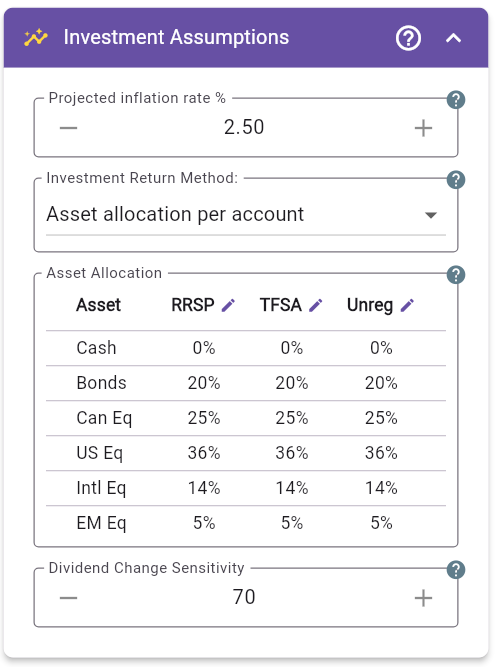
Figure 15: Investment Assumptions - Asset Allocation per Account
This panel sets inflation and return modeling assumptions that feed income, tax, and confidence-level projections.
Projected inflation rate (%) Long-term inflation assumption. MayRetire uses inflation to keep results in real-dollar terms and for calculations that require nominal tracking (for example, capital-gain tax effects).
Investment Return Method Choose one of two approaches:
Overall rate of return (simplified): enter one real
appreciation rate plus one dividend yield for the portfolio.Asset allocation per account: define account-level
asset mixes; MayRetire derives returns using FP Canada Projection
Assumption Guidelines.Note:
Overall rate of return (simplified)is a legacy what-if method. It uses synthetic, portfolio-wide assumptions and can be less realistic than account-level asset allocation, especially at high return inputs.
This mode is best for quick scenario testing (“what if returns are X?”) rather than selecting a recommended long-term portfolio.
Investment Price Appreciation % (inflation adjusted) Expected real capital growth excluding dividends. A value near 0 means growth roughly keeps pace with inflation.
Initial Dividend Yield Expected annual dividend income as a percent of portfolio value.
Dividend Change Sensitivity (DCS) Controls how dividend amounts respond to price changes. Example: DCS 50 means a 10% price move changes dividends by about 5% in the same direction. Example: if price rises 20%, DCS 50 implies ~10% higher dividends. Example: if price falls 30%, DCS 50 implies ~15% lower dividends. At DCS 100, dividend yield as a percentage of price remains roughly constant.
Unregistered Account Dividends Withdrawal Choose one:
Withdraw dividends first: prioritize dividend cash flow
before principal sales.As part of unregistered withdrawal: treat dividends and
principal as a pooled source.
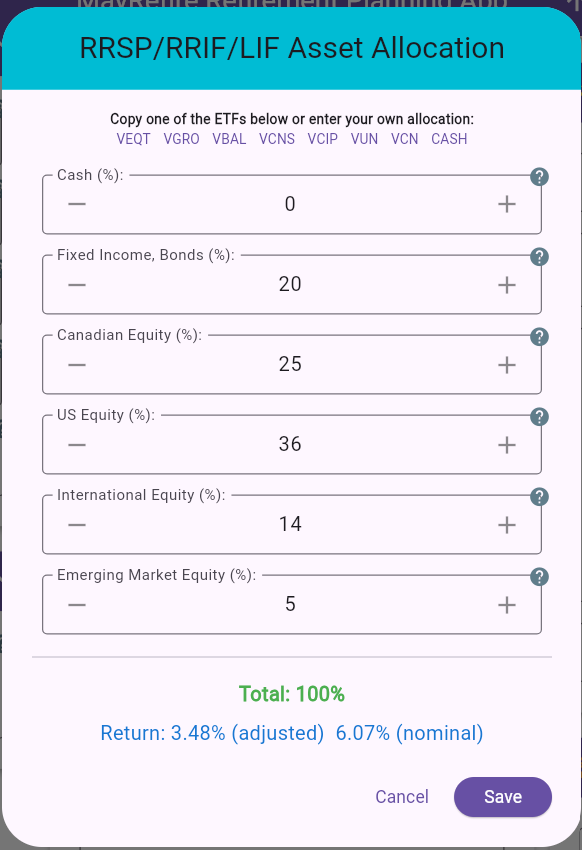
Figure 16: Asset Allocation Dialog (RRSP/RRIF/LIF)
In this method, users input allocation weights, not return rates.
Asset buckets and tax interpretation in non-registered context:
Editor features:
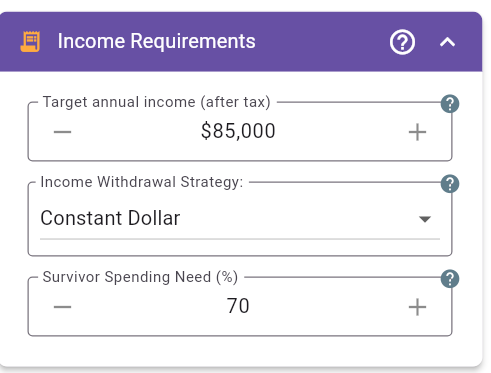
Figure 17: Income Requirements - Constant Dollar
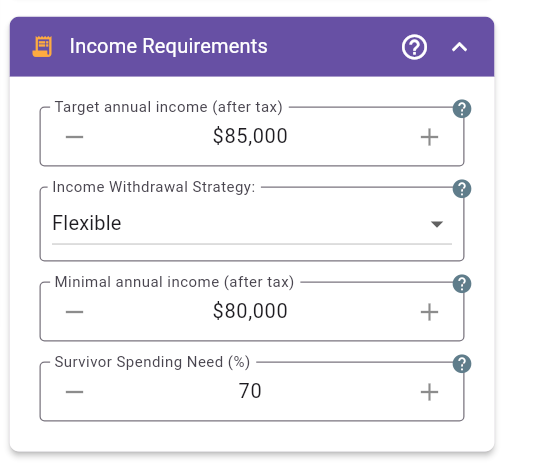
Figure 18: Income Requirements - Flexible
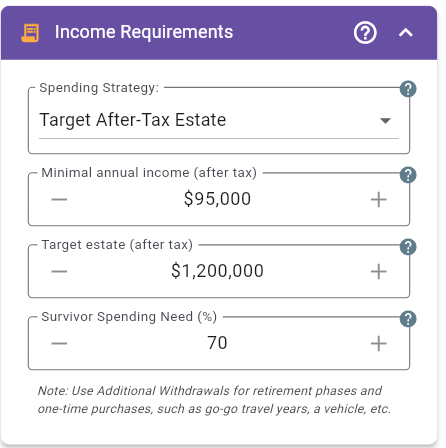
Figure 19: Income Requirements - Target After-Tax Estate
This panel defines after-tax spending requirements in today’s dollars (real purchasing power). Use it to choose whether the plan should target a specific spending level or find sustainable spending while preserving a desired estate.
Target annual income (after tax) (shown in Constant Dollar and Flexible modes) Preferred after-tax income level for normal retirement lifestyle spending.
Spending Strategy
Constant Dollar: stable real spending target year to
year.Flexible: income can adjust between target and minimum
based on plan strength and return conditions.Target After-Tax Estate: finds sustainable spending
while attempting to preserve the selected after-tax estate.Minimal annual income (after tax) (shown in Flexible and Target After-Tax Estate modes) Lower after-tax income floor MayRetire attempts to protect in weak scenarios.
Target estate (after tax) (shown in Target After-Tax Estate mode) Desired after-tax estate at the end of the plan, including the modeled net value of the estate after applicable taxes and debts.
Survivor Spending Need (%) (Couple mode) Percent of combined household budget the surviving spouse is expected to need. Common planning range is roughly 60% to 70%, because many fixed costs remain after one partner passes.
Flexible income is best understood as a planning guardrail, not an automatic real-life withdrawal rule. The target income represents preferred lifestyle spending, while the minimum income represents a lower level the plan should try to preserve when markets, balances, or other assumptions are under pressure.
For Calculate-style runs, MayRetire first tests whether the plan can support the full target income. If the target is not sustainable, it tests whether the minimum income is sustainable. If the minimum works, MayRetire searches between the minimum and target to find the highest income level that can still keep the plan funded under the selected assumptions or return sequence.
For simulation and backtesting runs, MayRetire also compares each scenario’s current asset path against a reference baseline. If assets are tracking below the reference path, the current year’s flexible income is reduced toward the minimum. If assets are healthy, income can remain closer to the target. The intent is to spend more when the plan has room and less when markets or balances are under pressure.
In practice, do not treat the flexible result as an exact spending rule for every future year. A more practical approach is to create an updated plan at least annually using current account balances, current pension and income details, updated debt or insurance assumptions, current tax context, and any changed priorities. At that point, you may also decide whether the target and minimum income range itself should move up or down.
The first year of the updated projection can then be used as guidance for the upcoming year’s cash flow, including planned spending, account withdrawals, taxes, contributions, debt payments or advances, and other income sources. In this sense, MayRetire helps answer: given where the plan stands now, what cash-flow plan looks reasonable for the next year while preserving the long-term plan?
Practical guidance:
Additional Withdrawals, such as travel years, vehicle
replacement, renovations, or health-care support.With Target After-Tax Estate, MayRetire searches for a
sustainable spending level that also leaves the requested after-tax
estate at the end of the plan. The minimum annual income remains an
important floor: a plan is not considered successful if that minimum
spending cannot be sustained, even when the remaining estate is above
the target.
The estate target represents inheritance after modeled estate taxes and debts and considers all modeled estate assets, including financial accounts, net real-estate equity, and insurance proceeds where applicable.
Reaching the precise target is not always possible. The calculation searches using practical income increments, and taxes, account withdrawals, asset sales, insurance proceeds, and other modeled events can cause the final estate to move in uneven steps. The projected estate may therefore finish somewhat above or below the requested amount.
Stress tests, simulations, and backtests apply different return and inflation paths without knowing those future paths in advance. As a result, they may produce substantially different spending and estate outcomes from the baseline calculation. For this strategy, a scenario is fully successful only when it sustains the minimum spending requirement and meets the estate target.
Setting Target estate (after tax) to $0 is
the special Die with Zero case. It removes the
requirement to preserve a positive inheritance and lets the calculation
seek higher sustainable spending, but it does not guarantee that the
final estate will be exactly zero. A positive estate may remain, and the
plan still fails if the minimum annual income cannot be sustained.
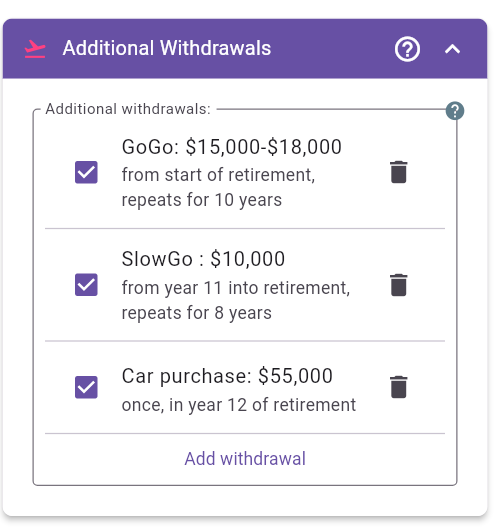
Figure 20: Additional Withdrawals panel with multiple planned withdrawals
This section lets you model discretionary or phase-specific spending that sits on top of your base income target. Typical use cases include travel phases, gifts, major purchases, family support, or one-time events.
Panel behavior:
Add withdrawal creates a new item using the edit
dialog.
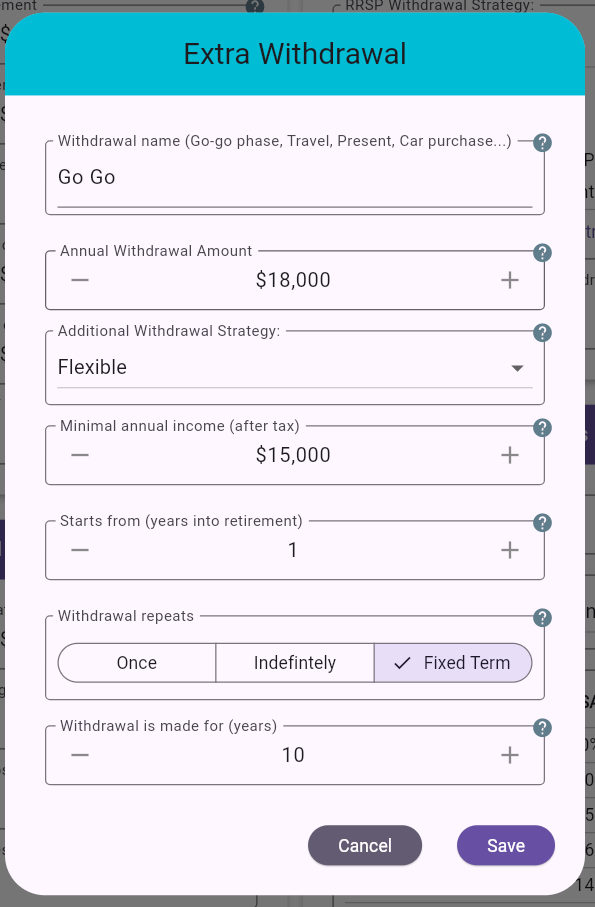
Figure 21: Additional Withdrawal edit dialog
Withdrawal name Use a descriptive label (for
example: Go-Go, Slow-Go,
Car purchase, Family support).
Annual Withdrawal Amount Target yearly amount for this withdrawal item.
Additional Withdrawal Strategy Choose one:
Constant Dollar: keeps the withdrawal amount fixed in
real terms.Flexible: allows the withdrawal to vary when needed,
subject to a minimum floor.Minimal annual income (after tax) (shown when strategy is Flexible) Minimum after-tax amount you still want to preserve for this withdrawal category.
Starts from (years into retirement) Offset from retirement start.
1 means first retirement year.11 means withdrawal starts in year 11 of
retirement.Withdrawal repeats Choose recurrence mode:
Once: one-time withdrawal.Indefinitely: continues through the full remaining
plan.Fixed Term: continues for a specified number of
years.Withdrawal Frequency (shown when the withdrawal is not Once) Choose how often the withdrawal occurs within the selected period:
Every year: applies annually.Every 2 years, Every 3 years, etc.:
applies only in matching interval years, starting from the selected
start year.Withdrawal is made for (years) (shown for Fixed Term) Number of years the withdrawal repeats.
Practical guidance:
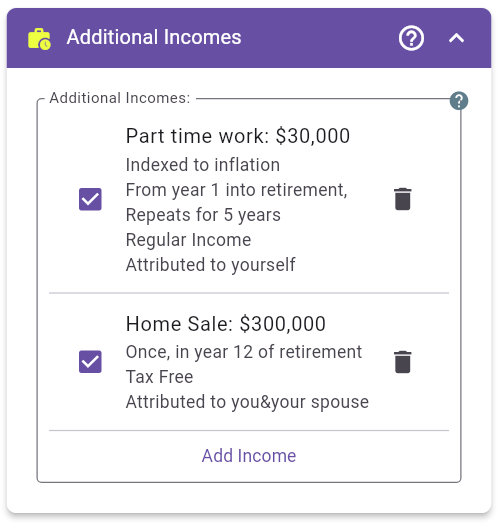
Figure 22: Additional Incomes panel with recurring and one-time income items
This section models non-portfolio income sources you expect during retirement. Common examples include part-time work, annuities, a business sale, inheritances, and other cash inflows.
Panel behavior:
Add Income opens the edit dialog.
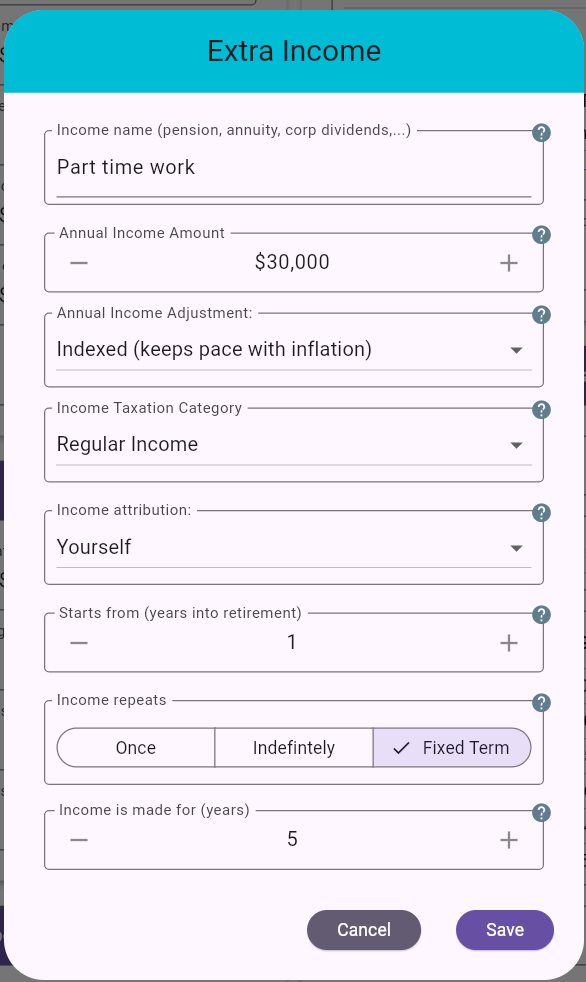
Figure 23: Additional Income edit dialog
Income name Use a clear label (for example:
Part-time work, Annuity,
Home sale, Inheritance).
Annual Income Amount Annual amount for this income stream. For one-time events, this is the one-time value.
Annual Income Adjustment Choose how the amount evolves over time:
Indexed (keeps pace with inflation): preserves
purchasing power in real terms.Fixed nominal (if selected): amount stays flat in
dollars and loses real value over time.Income Taxation Category Controls how the income
is taxed in projections (for example regular income vs tax-favoured
categories). Choose the category that best matches the real tax
treatment of this source. Under Taxed, you can choose:
Full amount: the entire income is taxed using the
selected category.Partially (annuity, etc.): only the entered taxable
percentage is taxed using the selected category, and the remainder is
treated as tax-free. This option was added mainly for annuities and
similar income streams where only part of each payment is taxable.Income attribution Assign income to
Yourself, Spouse, or both, depending on who
receives it. This matters for personal tax calculations and cash-flow
allocation in couple plans.
Starts from (years into retirement) Timing offset from retirement start.
1 means first retirement year.12 means year 12 of retirement.Income repeats Choose recurrence pattern:
Once: one-time income event.Indefinitely: repeats every year through the remaining
plan.Fixed Term: repeats for a selected number of
years.Income is made for (years) (shown for Fixed Term) Number of years that the income repeats.
Annuity example:
Taxed: Partially (annuity, etc.).
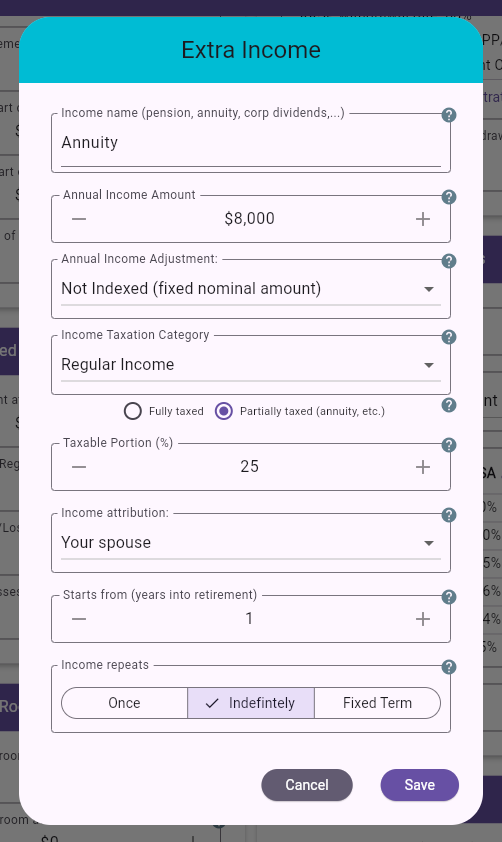
Figure 24: Additional Income dialog showing a partially taxed annuity example
Practical guidance:
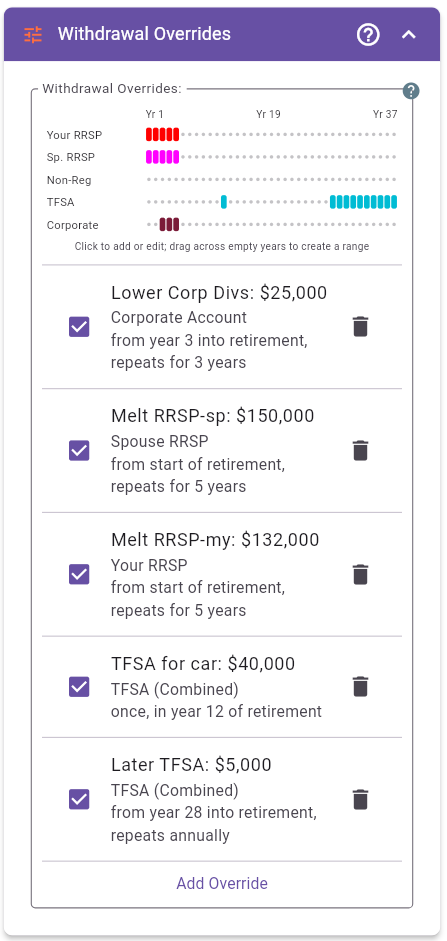
Figure 25: Withdrawal Overrides panel with account timeline and configured override periods
Withdrawal Overrides let you tailor selected account withdrawals when your preferences or planning objectives are not readily expressed through the automatic strategy settings. For example, you may prefer predictable, round-number RRSP withdrawals during the first years of retirement; reduce corporate dividends in a rental-property sale year to avoid layering dividend income on top of the sale’s taxable income; or fund a large purchase, such as a car, from the TFSA without disrupting an otherwise smooth taxable-income and tax-rate profile. Overrides can therefore support personal preferences, manual coordination of unusual financial events, and simple mental accounting for specific goals.
Withdrawal Overrides are different from Additional Withdrawals:
Override amounts are entered in today’s dollars.
The timeline provides a compact view of overrides across the retirement plan:
Yr 1 is the first year of retirement, not
a calendar year.The timeline colours distinguish account types; they do not indicate whether the requested withdrawal was fully achieved. Review the detailed annual projections and income results to see the actual outcome.
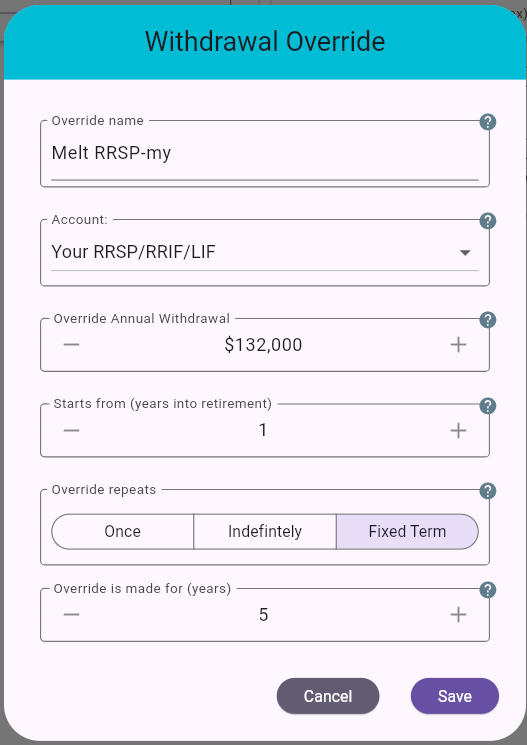
Figure 26: Withdrawal Override dialog with account, amount, start, and duration settings
Override name Enter a short, descriptive
reminder of why the override exists, such as
Early RRSP bridge, Preserve TFSA, or
Corporate dividends.
Account Select the account whose automatic withdrawal should be overridden:
Override Annual Withdrawal Requested annual withdrawal from the selected account. Zero is allowed and can be used to prevent discretionary withdrawals during the override period, subject to mandatory RRIF/LIF rules.
Starts from (years into retirement)
Retirement-year offset when the override begins. 1 applies
in the first year of retirement.
Override repeats Choose the duration:
Once: applies for one retirement year.Indefinitely: applies through the remainder of the
plan.Fixed Term: applies for the specified number of
years.Override is made for (years) (shown for Fixed Term) Number of consecutive retirement years for which the override applies.
An override is a requested account-withdrawal setting, not a guarantee that the exact amount will appear in the results. MayRetire still coordinates all income sources against the annual after-tax income target and applicable account rules.
The requested amount may not be fully used when:
Conversely, restricting withdrawals can leave annual income below the target even when money remains in an overridden account. This is intentional: once an override limits an account, MayRetire does not automatically exceed that limit merely to eliminate the income deficit.
Account-specific considerations:
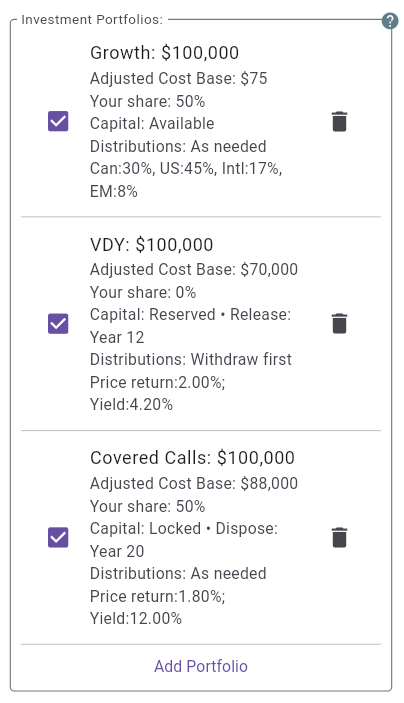
Figure 27: Investment Portfolios panel with multiple taxable portfolios
Investment Portfolios are optional taxable portfolios that coexist with the regular non-registered account. They are useful when you want a separate asset mix, tax attribution, access rule, or distribution policy for part of the household’s taxable assets.
Note: Investment Portfolios are supported when
Asset allocation is enabled.
Common uses:
Panel behavior:
Add Portfolio opens the multi-tab edit dialog.
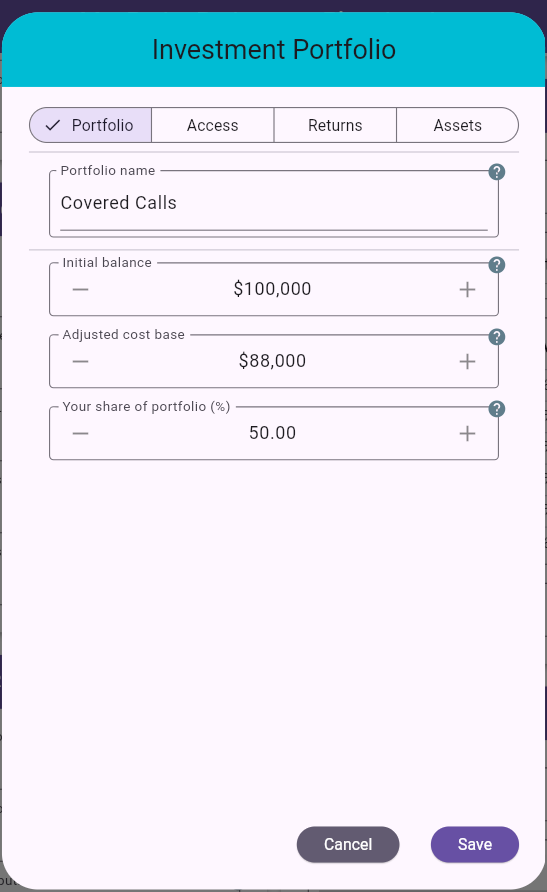
Figure 28: Investment Portfolio dialog - Portfolio tab
Portfolio name Use a clear label (for example:
Growth, Income ETF,
Emergency fund, or
Spouse taxable portfolio).
Initial balance Current market value of this portfolio, or the projected retirement-start value in planning mode.
Adjusted Cost Base Tax cost base of the portfolio. MayRetire uses this to estimate capital gains or losses when capital is withdrawn, the portfolio is liquidated, or the estate is calculated. In real-dollar projections, ACB is adjusted for inflation over time because the nominal tax cost base does not automatically grow with inflation. Management fees reduce portfolio market value without changing ACB or realizing a capital gain or loss.
Your share of portfolio (%) (Couple mode) Ownership/tax attribution assigned to you. The remainder is attributed to spouse while both spouses are alive.
Annual management fee Choose
Rate (%) to apply a percentage of the portfolio’s opening
annual market value, or Fixed amount ($/year) for a
separately charged annual dollar fee. A percentage fee can represent an
embedded MER, a percentage-based management or advisory fee, or a
combination of these costs. Percentage rates can range from
0% to 10%. A fixed fee cannot exceed the
portfolio’s opening balance or reduce it below zero.
Tax-deductible portion of fee (%) This field
appears when the selected fee is greater than zero. Use 0%
for an embedded ETF or mutual-fund MER. For a separately billed fee,
enter only the portion eligible for a personal tax deduction and exclude
services such as financial planning when they are not deductible. In
couple plans, MayRetire allocates the deductible amount using the
portfolio ownership share.
Practical guidance:
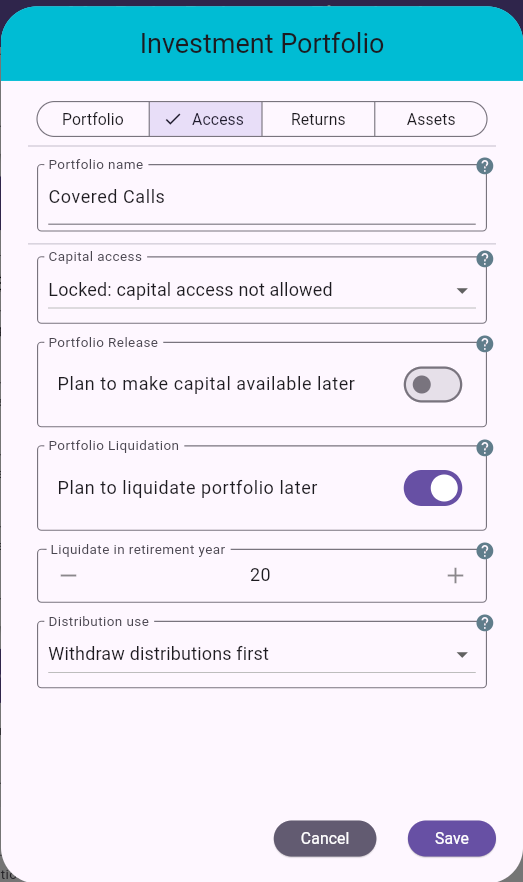
Figure 29: Investment Portfolio dialog - Access tab
This tab controls whether capital and distributions can be used to fund retirement income.
Capital access
Available: capital can be used like regular
non-registered assets.Reserved: capital is used only after regular
non-registered capital and available portfolio capital are
exhausted.Locked: capital is not used for retirement spending
unless the portfolio is later released or liquidated.Portfolio Release When enabled, a reserved or locked portfolio can become available in a selected retirement year. Release changes the access rule but keeps the portfolio intact.
Portfolio Liquidation When enabled, MayRetire sells the portfolio in the selected retirement year, realizes the capital gain/loss, and moves the proceeds into the regular non-registered account.
Distributions
Withdraw first: taxable distributions are consumed
before other income-gap withdrawals.As needed: distributions remain available and are used
only when needed to meet the income target.Reinvest only (shown for Locked capital):
distributions are still taxable, but they are not available for
retirement spending and remain invested in the portfolio.Practical guidance:
Reserved for assets intended as a last-resort
buffer.Locked for assets you do not want the
retirement-income engine to spend.Reinvest only when a locked portfolio should stay
outside retirement cash flow, including its annual distributions.
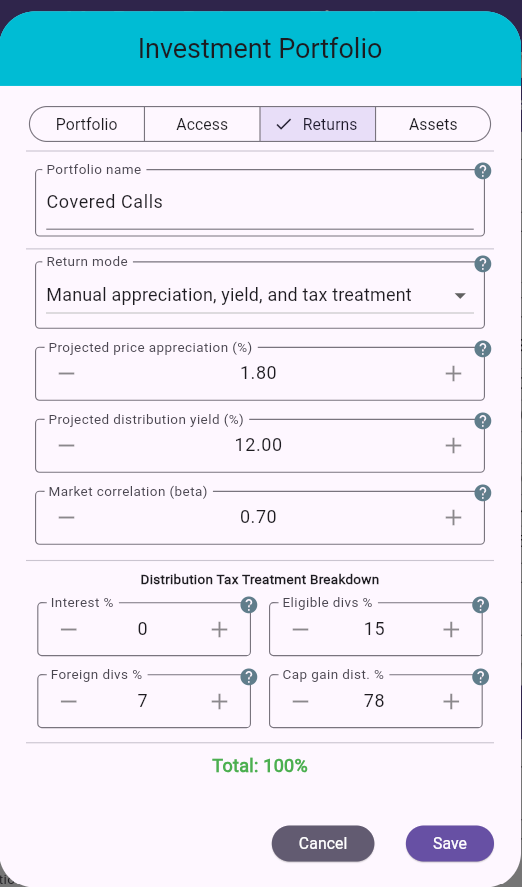
Figure 30: Investment Portfolio dialog - Returns tab
This tab defines how the portfolio produces price growth and taxable distributions.
Return mode
Asset allocation using FP Canada Assumptions: return
and distribution assumptions come from the portfolio’s asset mix.Manual appreciation, yield and tax treatment: you enter
projected price appreciation, distribution yield, and tax-treatment
breakdown.Projected Price Appreciation (%) (Manual mode) Expected real price growth before distributions.
Projected Distribution Yield (%) (Manual mode) Expected annual distribution as a percentage of portfolio value.
Market correlation (Beta) (Manual mode) Controls how strongly the manual portfolio responds to market behavior from the reference allocation in simulations. A higher value makes the portfolio move more with the reference allocation; lower or negative values reduce or invert that relationship.
Distribution Tax Treatment Breakdown (Manual mode) Split the projected cash distribution across interest, return of capital (ROC), eligible dividends, non-eligible dividends, foreign dividends, and capital gain distributions. These six components must total 100% before the dialog can be saved. ROC normally reduces ACB instead of creating current taxable income; ROC beyond the remaining ACB becomes a realized capital gain.
Annual Portfolio Turnover (%) (Both return modes) Enter the percentage of the portfolio assumed to be sold and reinvested each year. Turnover realizes the same percentage of the portfolio’s embedded gain or loss, produces no spendable cash, and does not change its market value. Reinvesting the proceeds moves ACB proportionally toward market value. For example, 20% turnover realizes 20% of the difference between portfolio value and ACB.
Practical guidance:
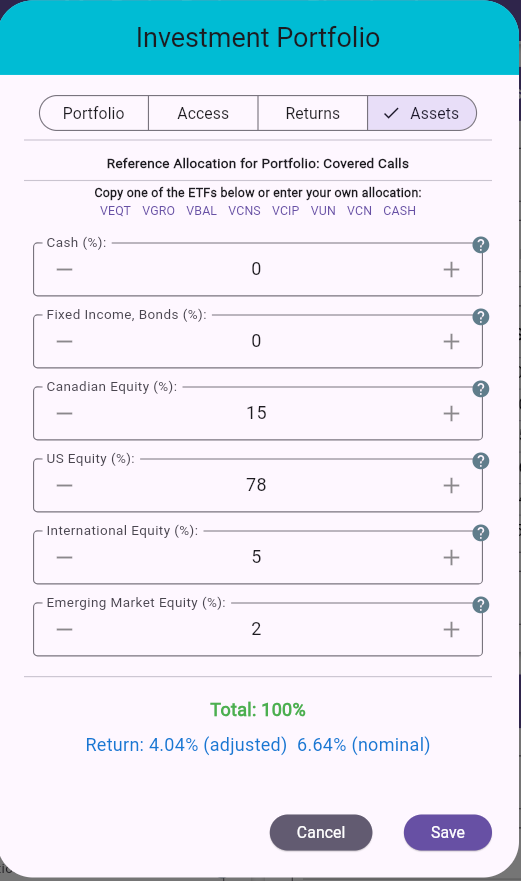
Figure 31: Investment Portfolio dialog - Assets tab
This tab sets the portfolio’s asset allocation.
In asset-allocation return mode, this allocation directly drives expected price return and distribution assumptions. In manual return mode, it acts as the reference allocation used for market correlation and simulation behavior.
Asset allocation inputs Set portfolio mix across
Cash, Fixed Income/Bonds,
Canadian Equity, US Equity,
International Equity, and
Emerging Market Equity.
ETF shortcuts Quick presets for common ETF-style allocations.
Total % check Allocation must total 100%.
Practical guidance:
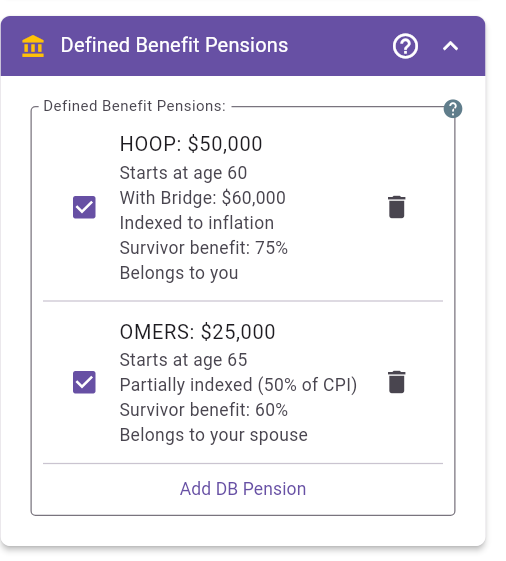
Figure 32: Defined Benefit Pensions panel with multiple pension records
Use this section for employer pensions that provide predictable lifetime income. Properly entering bridge benefits, indexation, and survivor percentage is important because these settings directly affect long-term cash flow and estate outcomes.
Panel behavior:
Add DB Pension opens the pension edit dialog.
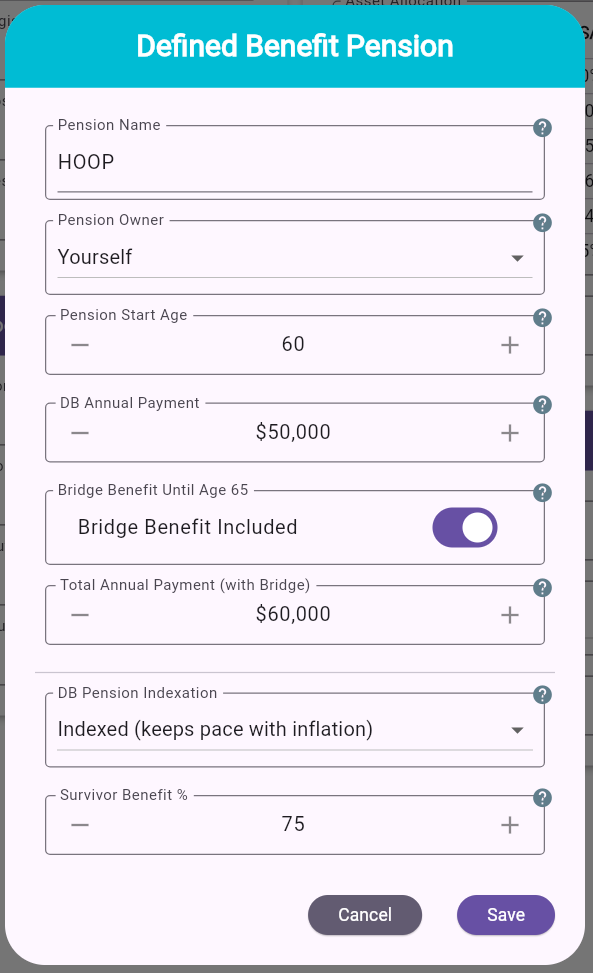
Figure 33: Defined Benefit Pension edit dialog
Pension Name Use a clear plan name (for example:
HOOPP, OMERS, Teachers,
Employer DB Plan).
Pension Owner Select who receives this pension
(Yourself or Spouse). Owner selection affects
tax calculation and survivor planning in couple scenarios.
Pension Start Age Age when payments begin.
DB Annual Payment Base annual lifetime payment (excluding temporary bridge benefit).
Bridge Benefit Until Age 65 Enable this if the plan pays a temporary top-up before age 65.
Total Annual Payment (with Bridge) (shown when bridge is enabled) Combined annual payment before age 65, including base pension plus bridge amount.
DB Pension Indexation Defines how pension payments change over time. Common options include:
Indexed (keeps pace with inflation): payment rises with
CPI to preserve purchasing power.Not indexed: payment is flat in nominal dollars.Partially indexed: payment tracks only part of
CPI.Custom fixed rate: payment rises by a fixed nominal
percentage each year.Partial indexing (%) (shown when Partially
indexed is selected) Percent of CPI passed through to pension
increases (for example 50% of CPI).
Fixed annual increase (%) (shown when Custom fixed rate is selected) Nominal annual increase applied each year.
Survivor Benefit % Portion of pension that
continues to the survivor after first death. Typical values are
0, 50, 60, 66,
75, or 100, depending on plan option.
Survivor Bridge Treatment (shown when bridge benefit and survivor benefit are both applicable) Controls how a temporary bridge benefit is treated if the pension owner dies before age 65. Some plans calculate the survivor benefit from the lifetime pension only, while others include the bridge temporarily or permanently. Use your DB pension statement to choose the matching option.
Practical guidance:
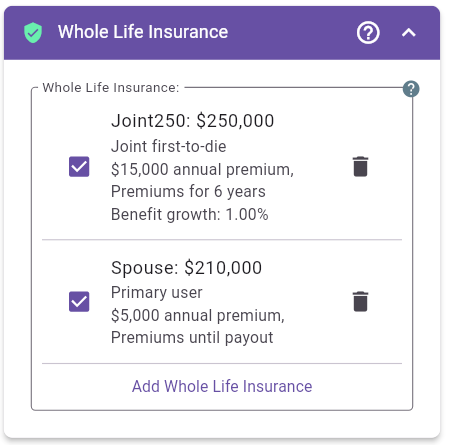
Figure 34: Whole Life Insurance panel with benefit amount summary
Use this section to model whole life insurance policies that have predictable premiums and a predictable death benefit. This includes participating whole life, non-participating whole life, and Term-to-100 style policies. MayRetire does not attempt to model Universal Life mechanics.
Insurance can affect the plan in three ways:
Panel behavior:
Add Insurance opens the insurance edit dialog.
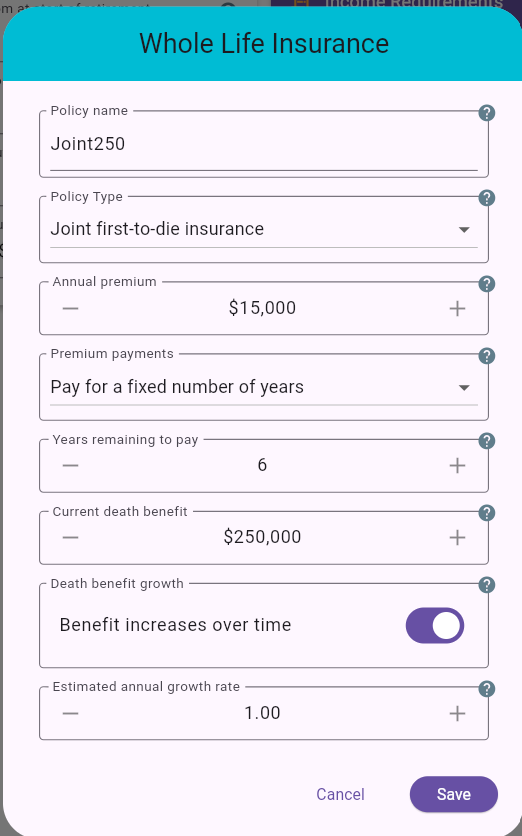
Figure 35: Whole Life Insurance edit dialog
Policy name Use a clear name for the policy,
such as Whole Life, Participating WL, or the
insurer name.
Policy Type (Couple mode) Choose when the policy pays out:
Your life insuranceSpouse's life insuranceJoint first-to-die insuranceJoint last-to-die insuranceIn single plans, MayRetire treats the policy as your own life insurance and does not show the policy-type selector.
Annual premium Fixed nominal premium paid each year while premiums are still required. Because this is a nominal amount, its real cost declines over time with inflation.
Premium payments Choose how long premiums continue:
No more premium payments: the policy is paid up.Payments until insurance payout: premiums continue
while the policy is active in the plan.Pay for a fixed number of years: premiums continue for
a fixed number of remaining years.Years remaining to pay (shown when Premium payments is Pay for a fixed number of years) Number of years premiums still need to be paid.
Current death benefit Current nominal death benefit amount.
Benefit increases over time Turn this on when the death benefit is expected to grow, such as from participating dividends or paid-up additions.
Estimated annual growth rate % (shown when
benefit growth is enabled) Estimated annual nominal growth rate for
the death benefit. Use 0 or leave growth off for a fixed
death benefit.
Practical guidance:
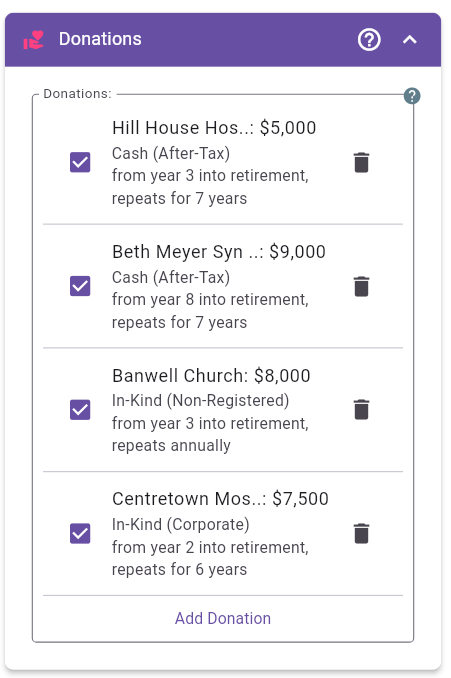
Figure 36: Donations panel with multiple charitable gifts
Use this section to model charitable giving as part of your retirement plan. Donations can be repeated, timed for specific years, and funded in different ways so you can compare both cash-flow impact and tax efficiency.
Panel behavior:
Add Donation opens the donation edit dialog.
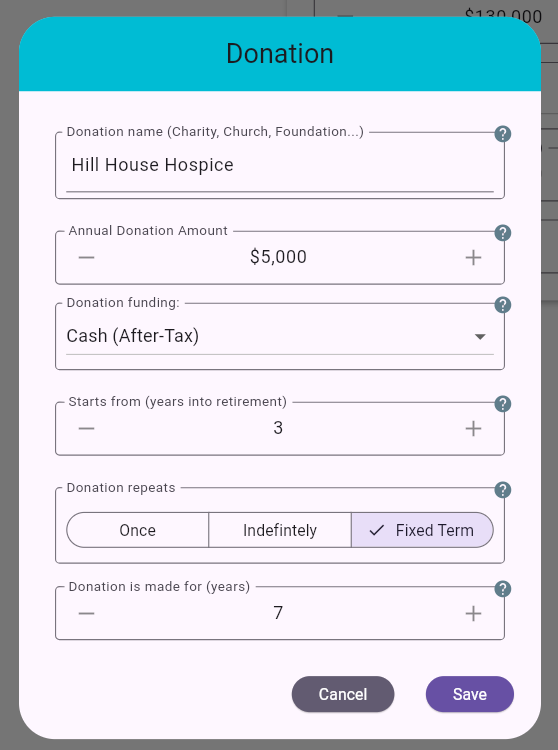
Figure 37: Donation edit dialog
Donation name Use a clear label for the charity
or purpose (for example: Hospital Foundation,
Church, Food Bank,
Family Foundation).
Annual Donation Amount Target amount donated each year while this donation is active.
Donation funding Choose how the gift is funded:
Cash (After-Tax): donation is funded from personal
after-tax cash flow.In-Kind (Non-Registered): donation is made using
eligible securities or funds from the personal non-registered
account.In-Kind (Corporate): donation is made using eligible
securities or funds held inside the corporation.Donation repeats Choose recurrence pattern:
Once: one-time donation event.Indefinitely: repeats every year through the remaining
plan.Fixed Term: repeats for a selected number of
years.Donation is made for (years) (shown for Fixed Term) Number of years the donation repeats.
Practical guidance:
Cash (After-Tax) when you want the donation funded
directly from annual spending cash flow.
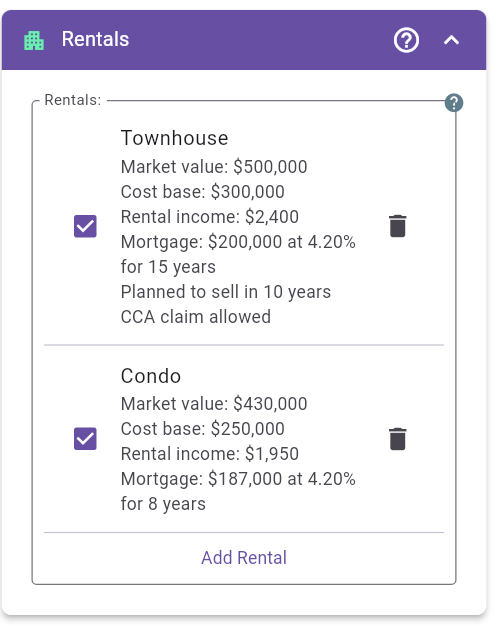
Figure 38: Rentals panel with multiple properties
This section captures rental-property cash flow, financing, planned disposition, and tax treatment so projections include both ongoing rental income and eventual sale/estate outcomes.
Panel behavior:
Add Rental opens the multi-tab rental property
dialog.
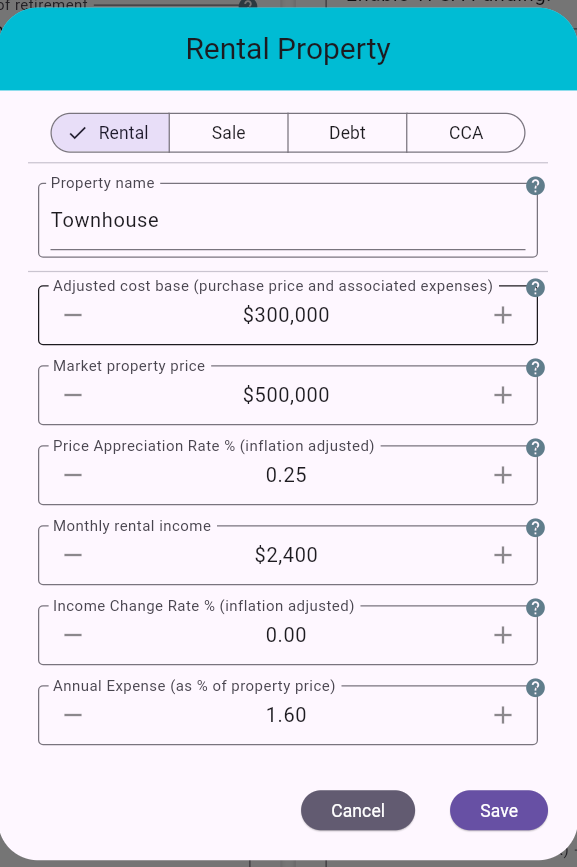
Figure 39: Rental Property dialog - Rental tab
Property name Descriptive label for the property
(for example: Townhouse, Condo,
Duplex).
Rental owner For couple plans, select whether the property is owned jointly, by you, or by your spouse. Joint ownership is the default. While both spouses are alive, MayRetire attributes rental income, expenses, mortgage interest, sale proceeds, and rental-related tax amounts according to the selected owner. If one spouse passes away, MayRetire assumes the rental property transfers to the survivor.
Adjusted cost base (purchase price and associated expenses) Your tax cost base, including purchase price and eligible acquisition/capital-improvement costs. Used to estimate capital gains when the property is sold.
Market property price Current estimated market value of the property.
Price Appreciation Rate % (inflation adjusted)
Expected long-term real appreciation rate. 0% means the
property grows with inflation only.
Monthly rental income Gross monthly rent before expenses.
Income Change Rate % (inflation adjusted) Real
growth rate of rental income. 0% means rent keeps pace with
inflation. Negative values mean rent lags inflation; positive values
mean it grows faster than inflation.
Annual Expense (as % of property price) Operating costs as a percentage of property value (for example maintenance, condo fees, insurance, vacancy, property tax, and management).
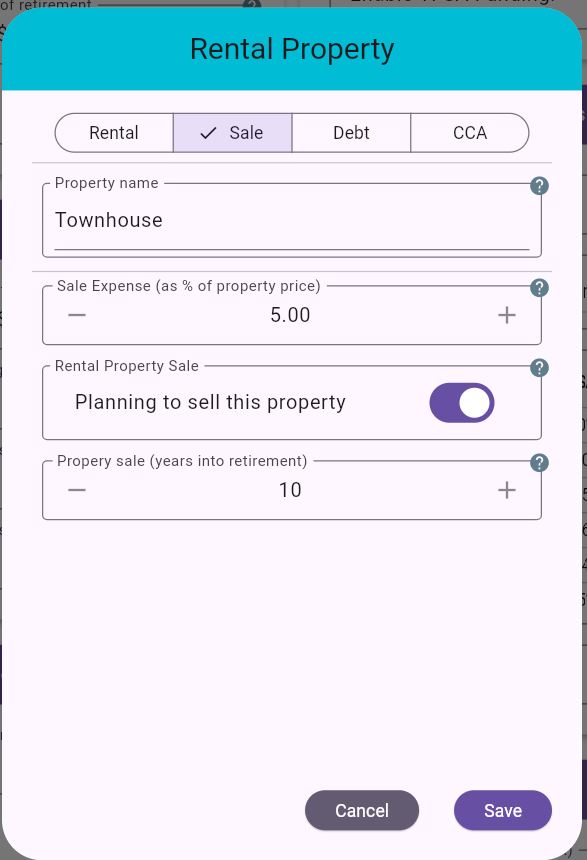
Figure 40: Rental Property dialog - Sale tab
Property name Shown on each tab for context.
Sale Expense (as % of property price) Estimated transaction costs at sale (for example realtor commissions and legal fees).
Rental Property Sale Toggle whether this property is planned to be sold during the planning horizon.
Property sale (years into retirement) (shown
when sale is enabled) Timing of sale relative to retirement start.
10 means planned sale in year 10 of retirement.
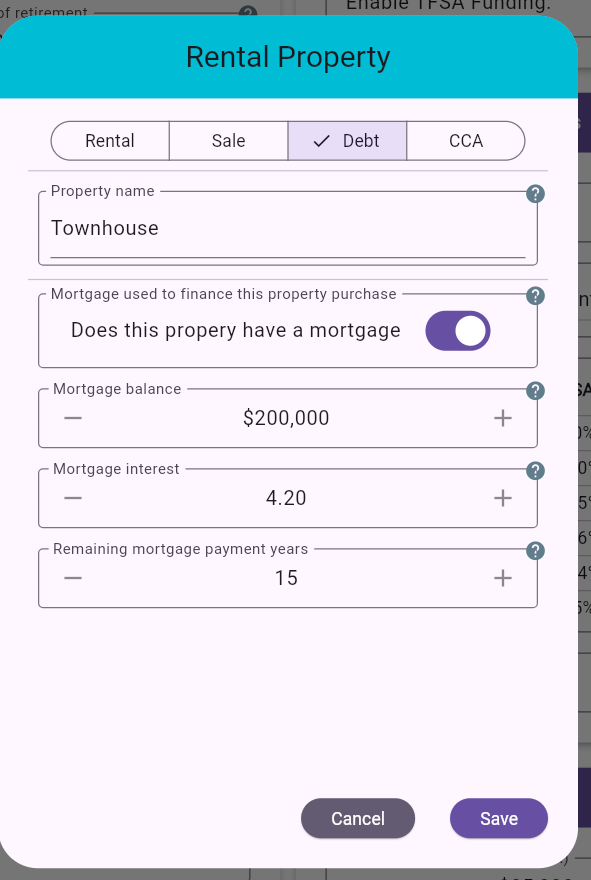
Figure 41: Rental Property dialog - Debt tab
Property name Shown on each tab for context.
Does this property have a mortgage Toggle mortgage financing on/off for this property.
Mortgage balance (shown when mortgage is enabled) Current outstanding mortgage principal.
Mortgage interest (shown when mortgage is enabled) Annual interest rate on the mortgage.
Remaining mortgage payment years (shown when mortgage is enabled) Years left to repay the mortgage.
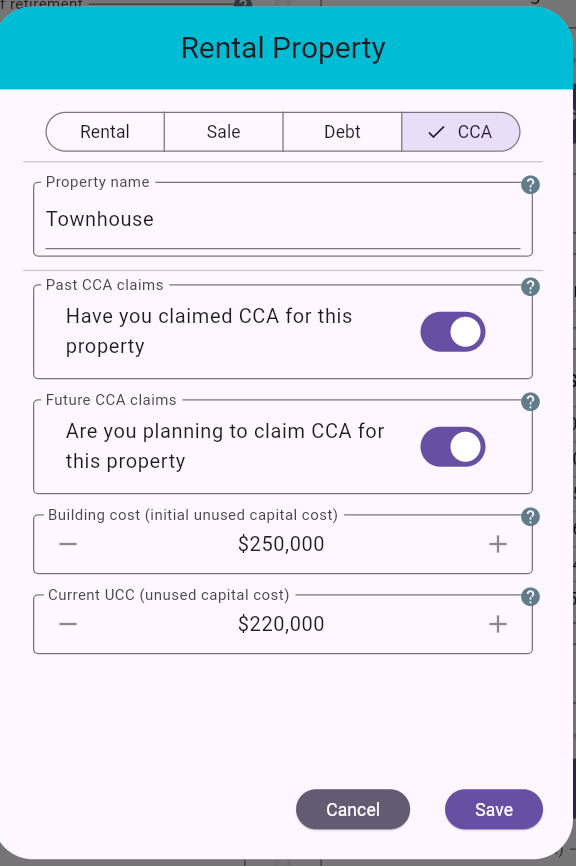
Figure 42: Rental Property dialog - CCA tab
Property name Shown on each tab for context.
Have you claimed CCA for this property Indicates whether CCA was claimed historically.
Are you planning to claim CCA for this property Controls whether future CCA claims are modeled.
Building cost (initial unused capital cost) Original building component used as the starting CCA basis.
Current UCC (unused capital cost) Remaining depreciable balance for future CCA claims.
Practical guidance:
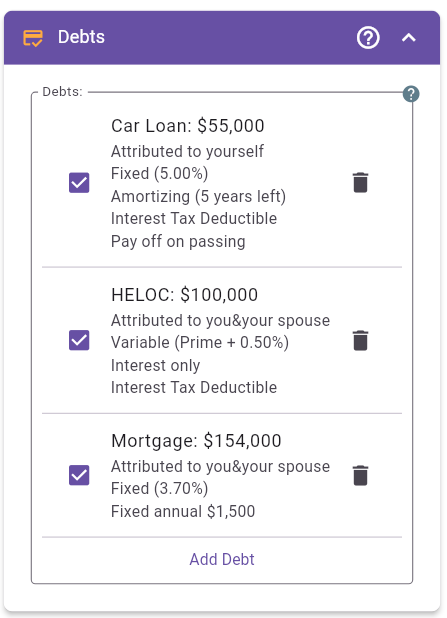
Figure 43: Debts panel with multiple debt items
This section lets you model personal or household debt that continues through retirement, such as a mortgage, HELOC, car loan, reverse-mortgage-style borrowing, or other loan. Debt can start as an existing balance at retirement, or it can begin later as future borrowing. Debt affects required cash flow, taxes when interest is deductible, income-source reporting when borrowing proceeds are advanced, and net estate at death.
Panel behavior:
Add Debt opens the debt edit dialog.
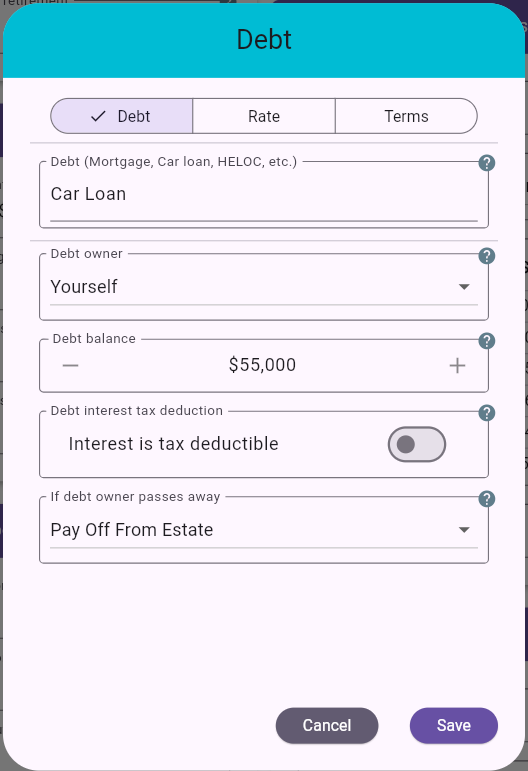
Figure 44: Debt dialog - Debt tab
Debt (Mortgage, Car loan, HELOC, etc.) Use a descriptive name so the debt is easy to identify in the panel and detailed projections.
Debt owner (Couple mode) Choose whether the debt is attributed to you, your spouse, or both jointly. This affects survivor treatment and tax attribution for deductible interest.
Existing debt / Future borrowing Use
Existing debt for a loan that already exists at the start
of the plan. Use Future borrowing for a loan that begins in
a later retirement year.
Debt balance (existing debt) Current outstanding balance at retirement start, or the current balance if already retired.
Starts in year of retirement (future
borrowing) Year when the future debt begins. 1 means
the first year of retirement.
Initial borrowing amount (future borrowing) One-time amount advanced when the future debt begins. This becomes the starting balance of the debt in that year.
Debt interest tax deduction Turn this on only when interest on the debt is legitimately deductible. When enabled, MayRetire applies the deduction according to who the debt is attributed to.
If debt owner passes away (shown only in couple plans for single-owner debt) Choose whether the debt transfers to the surviving spouse or is paid off from estate at first death.
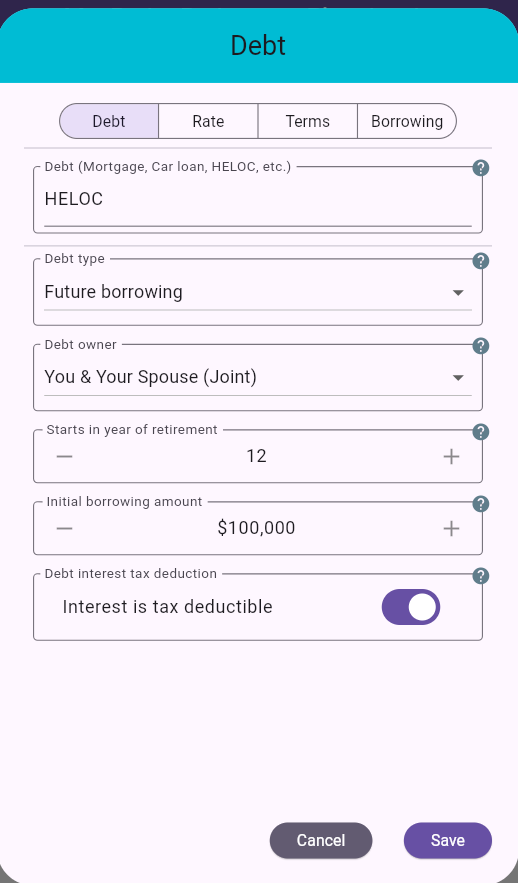
Figure 45: Debt dialog - Future borrowing setup
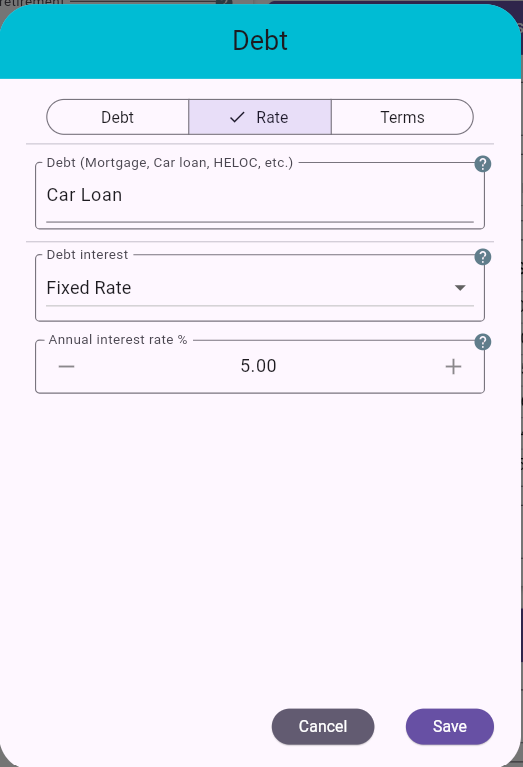
Figure 46: Debt dialog - Rate tab
Debt interest Choose Fixed Rate or
Variable Rate.
Annual interest rate % (shown for fixed rate) Annual fixed borrowing rate used for the debt projection.
Prime spread % (shown for variable
rate) Spread relative to prime. Example: 0.50 means
Prime + 0.50%. Example: -0.75 means
Prime - 0.75%.
Practical note:
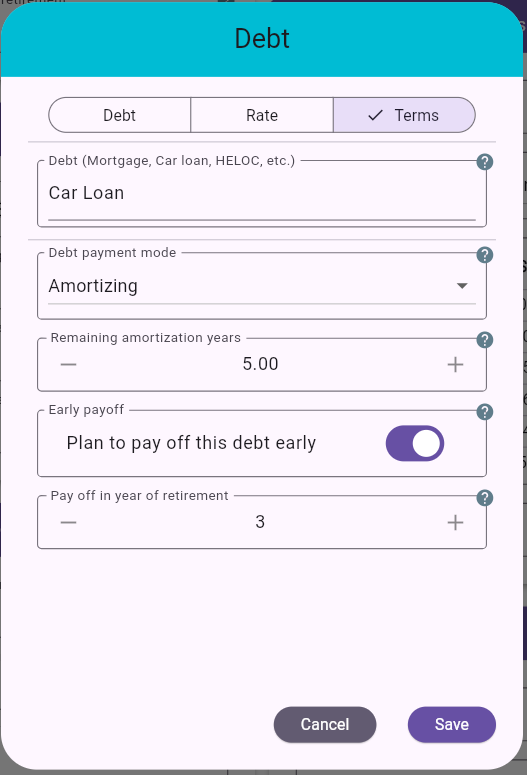
Figure 47: Debt dialog - Terms tab
Debt payment mode Choose one:
AmortizingInterest OnlyFixed Annual PaymentCapitalized InterestRemaining amortization years (shown for amortizing mode) Years left to repay the debt under standard amortizing payments.
Fixed annual payment amount (shown for fixed annual payment mode) Annual amount paid toward the debt each year.
Capitalized interest Interest is added to the debt balance instead of being paid as a regular annual debt payment. Use this for reverse-mortgage-style borrowing or other debt where interest accumulates until payoff, sale, death, or the end of the plan.
Pay off on principal residence sale or downsizing Turn this on when the debt should be fully paid off in the same retirement year that the principal residence is sold or downsized. When this option is enabled, MayRetire hides and ignores the manual early-payoff year because the payoff timing follows the principal residence plan.
Plan to pay off this debt early Use this when you expect to repay the debt in full before its normal schedule ends.
Pay off in year of retirement (shown when
early payoff is enabled) Timing of the extra full payoff relative
to retirement start. 1 means the first year of
retirement.
Practical guidance:
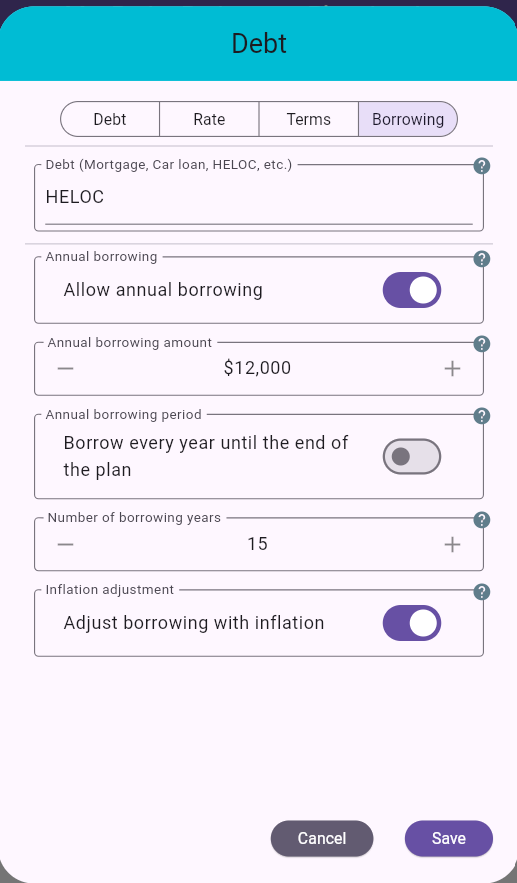
Figure 48: Debt dialog - Borrowing tab
Use this tab when the debt can provide additional scheduled or as-needed borrowing after the initial balance or initial borrowing amount. Borrowing proceeds are treated as debt advances: they increase the debt balance and appear as a separate income source in charts and projections.
Allow annual borrowing Turn this on to add recurring annual borrowing to the debt.
Borrow only when needed Turn this on when the debt is intended as a safety net rather than a planned annual draw. When enabled, MayRetire does not borrow automatically every year. It uses the debt only if other funding sources are not enough to meet the required income level. If the plan never needs the extra cash, no borrowing occurs. This can be useful for testing resilience against less likely but important later-life risks, such as expensive health care, long-term care, or other large support needs. For example, a HELOC, reverse-mortgage-style loan, or borrowing against permanent life insurance may provide a backstop without requiring you to reduce lifestyle assumptions in the base plan. The feature lets you model that safety net while still seeing whether, when, and how much borrowing would actually be needed. This option is available for interest-only and capitalized-interest debts.
Annual borrowing amount / Annual borrowing amount
limit When Borrow only when needed is off, this is
the amount advanced each year while annual borrowing is active. When
Borrow only when needed is on, this is the maximum amount
MayRetire can borrow in a year if other funding is not enough.
Debt balance limit (shown when Borrow only when needed is enabled) Turn this on to cap total borrowing for this debt.
Maximum debt balance (shown when Debt balance limit is enabled) Highest total debt balance allowed for flexible borrowing. If borrowing is adjusted with inflation, this limit is adjusted the same way.
Annual borrowing period Choose whether borrowing continues every year until the end of the plan, or only for a fixed number of years.
Number of borrowing years (shown when borrowing is not until end) Number of years the annual borrowing amount is advanced.
Adjust borrowing with inflation Turn this on when future annual borrowing amounts should increase with inflation.
Practical guidance:
Borrow only when needed
so borrowing happens only if other funding is insufficient.
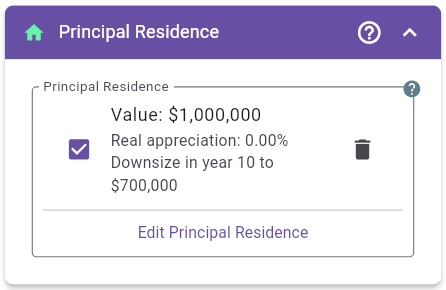
Figure 49: Principal Residence panel with residence summary
Use this section to model your principal residence separately from investment accounts and rental properties. The residence can be kept to the end of the plan, sold, or downsized to another property. MayRetire treats the principal residence as part of estate value while it is owned, and records sale or downsizing proceeds as cash flow in the disposition year.
Panel behavior:
Edit Principal Residence opens the residence edit
dialog.Remove Principal Residence removes the residence from
the plan.
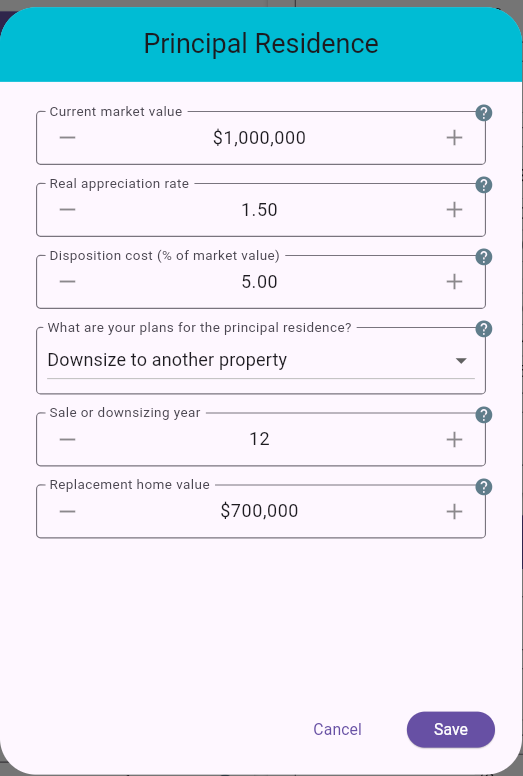
Figure 50: Principal Residence edit dialog
Current market value Estimated current value of the principal residence.
Real appreciation rate Expected annual property appreciation after inflation. This is consistent with rental-property assumptions, where appreciation is entered in real terms.
Disposition cost Estimated selling or disposition cost as a percentage of property value. This reduces estate value and sale/downsize proceeds.
What are your plans for the principal residence? Choose one:
Keep property: residence remains part of the estate
through the plan.Sell property: residence is sold in the configured year
and net proceeds become available cash flow.Downsize to another property: current residence is sold
and replacement home value is deducted from proceeds.Sale / downsizing year Retirement year when the
sale or downsizing occurs. 1 means the first year of
retirement.
Replacement home value (shown when downsizing) Cost of the new principal residence. If replacement value is lower than net sale proceeds, the difference is modeled as residence proceeds. If replacement value is higher, the difference is modeled as a residence shortfall.
Practical guidance:
Keep property when the home is intended to remain
part of the final estate.Sell property when the plan relies on fully
unlocking home equity.Downsize to another property when only part of the
home equity is expected to become available.Pay off on principal residence sale or downsizing.
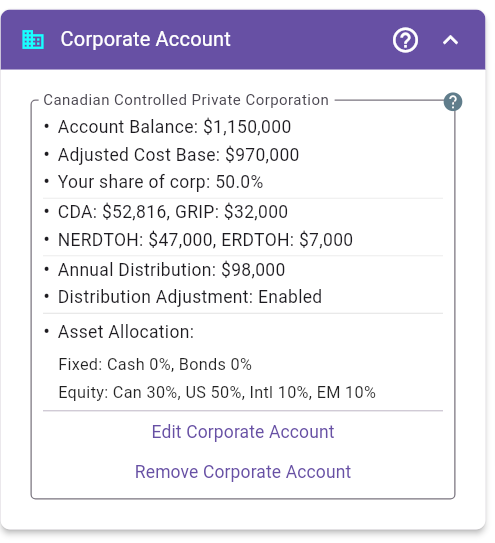
Figure 51: Corporate Account panel with account summary
Use this section for a Canadian Controlled Private Corporation (CCPC) investment account that supports retirement funding through dividends and tax-efficient corporate distributions.
Panel behavior:
Edit Corporate Account opens a 3-tab dialog
(Account, Assets,
Dividends).Remove Corporate Account deletes the corporate-account
setup from the plan.
Figure 52: Corporate Account panel when no corporate account is configured
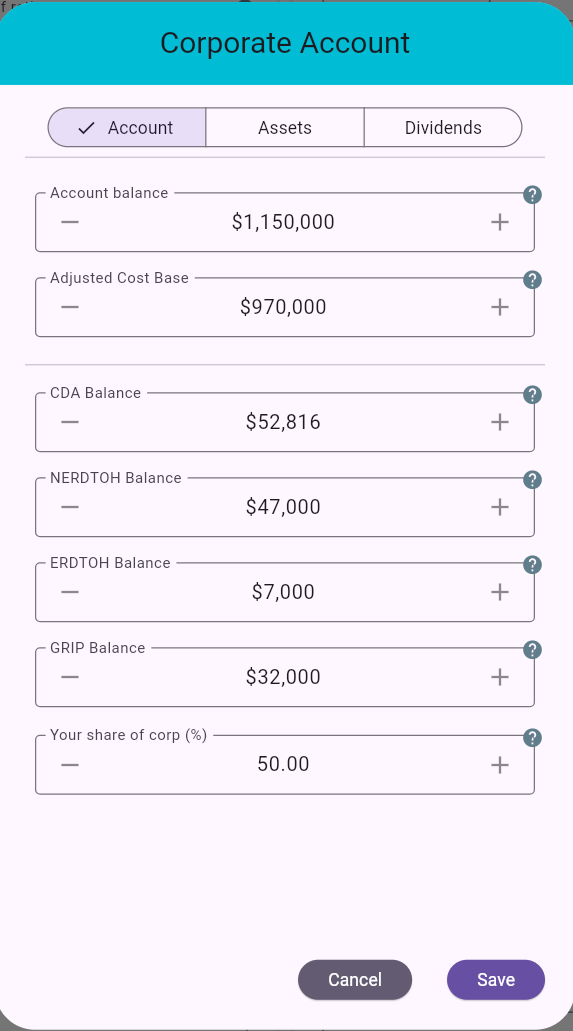
Figure 53: Corporate Account dialog - Account tab
Account balance Current market value of the corporation’s investment portfolio.
Adjusted Cost Base Tax cost base of corporate investments (purchase cost plus acquisition costs), used to calculate capital gains when assets are sold.
CDA Balance Capital Dividend Account balance available for tax-free capital dividends.
NERDTOH Balance Non-Eligible Refundable Dividend Tax on Hand. Represents refundable corporate tax generally recovered when non-eligible dividends are paid.
ERDTOH Balance Eligible Refundable Dividend Tax on Hand. Represents refundable corporate tax generally recovered when eligible dividends are paid.
GRIP Balance General Rate Income Pool balance. Determines how much can be paid as eligible dividends.
Your share of corp (%) Your ownership percentage. In couple mode, the remainder is treated as spouse ownership for attribution purposes.
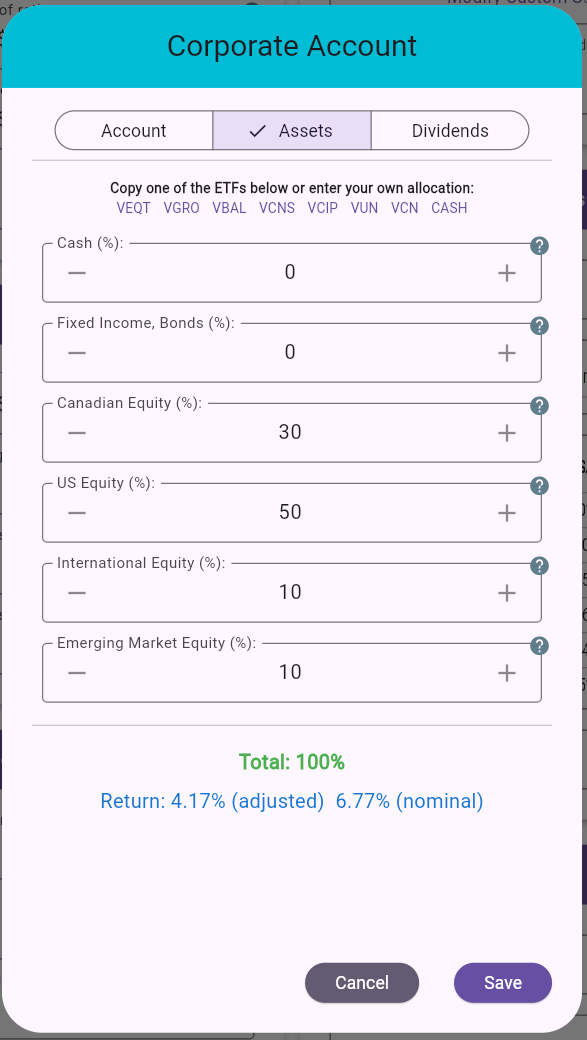
Figure 54: Corporate Account dialog - Assets tab
Asset allocation inputs Set corporate portfolio
mix across: Cash, Fixed Income/Bonds,
Canadian Equity, US Equity,
International Equity, and
Emerging Market Equity.
ETF shortcuts Quick presets for common ETF-style allocations.
Total % check Allocation must total 100%.
Implied return display Dialog shows implied adjusted/nominal return from the selected mix. In asset-allocation mode, MayRetire derives expected returns from asset-class assumptions (aligned with FP Canada projection guidelines), rather than asking you to enter a single return manually.
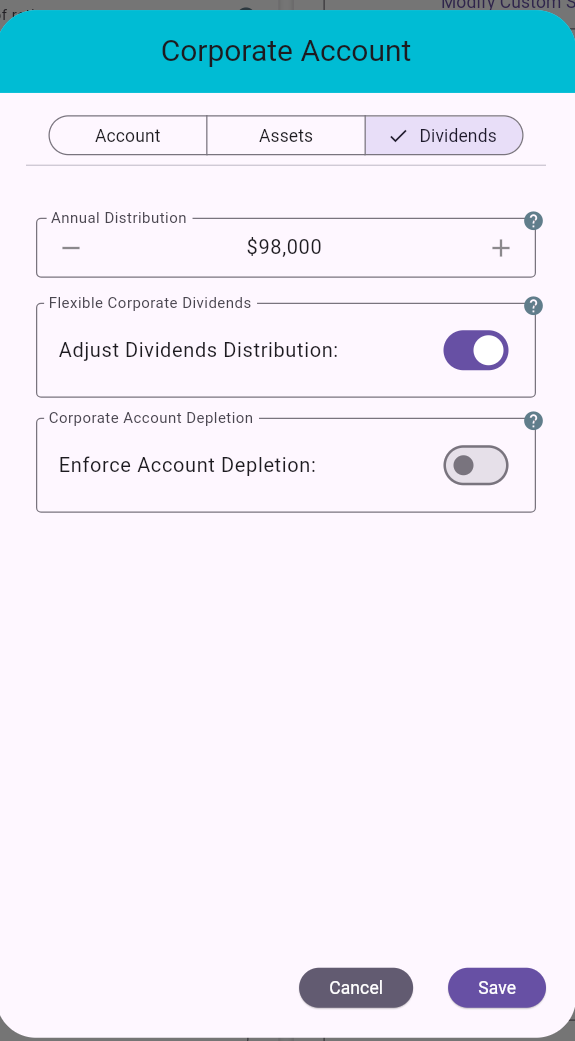
Figure 55: Corporate Account dialog - Dividends tab
Annual Distribution Base annual dividend amount to distribute from the corporation. MayRetire determines a tax-efficient composition of capital/eligible/non-eligible dividends for this payout.
Adjust Dividends Distribution When enabled, MayRetire adjusts annual corporate dividends to help bridge income needs (instead of using only a fixed dividend amount).
Enforce Account Depletion When enabled, MayRetire targets a payout path that fully depletes the corporate account by plan end.
MayRetire models corporate notional accounts to estimate how a CCPC investment portfolio may distribute cash during retirement. These balances are planning inputs and projections, not replacements for corporate tax records or professional tax filings.
Realized capital losses can reduce CDA and may create a negative CDA balance in the projection. A negative CDA must be offset by future CDA additions before tax-free capital dividends are available again.
NERDTOH is generally recovered when the corporation pays non-eligible dividends.
ERDTOH is generally recovered when the corporation pays eligible dividends. It can also be recovered through non-eligible dividend spillover when there is not enough GRIP to pay eligible dividends.
In MayRetire’s corporate investment-account model, GRIP is increased from eligible Canadian dividends received by the corporation. In real corporate tax planning, GRIP can also arise from other sources, such as active business income taxed at the general corporate rate. MayRetire does not currently model those additional GRIP-generating sources because this feature is intended for retirement planning with a CCPC investment portfolio, not for detailed operating-company tax planning.
When MayRetire distributes corporate cash, it uses a tax-aware dividend waterfall:
CDA first Positive CDA is paid first as tax-free capital dividends.
Eligible dividends next Eligible dividends are paid next, limited by available GRIP. These dividends reduce GRIP and recover ERDTOH where ERDTOH is available.
Non-eligible dividends after that Remaining required dividends are paid as non-eligible dividends. These recover NERDTOH first.
ERDTOH spillover If non-eligible dividends create more refund capacity than the remaining NERDTOH balance, the excess capacity can recover ERDTOH.
Refund sweep When dividend refunds create additional cash that can help meet the target distribution, MayRetire may sweep that refund out as additional non-eligible dividends. This uses the same NERDTOH-first, ERDTOH-spillover ordering.
MayRetire treats dividend refunds as part of the same annual corporate tax/refund settlement. In practice, a cash refund may be received after the corporation files its tax return, so exact cash timing can differ. For retirement projections, MayRetire applies the full refund in the current projection year as an annual net-tax simplification, similar to treating a tax refund as reducing the year’s overall tax drag.
Excess GRIP with no ERDTOH The corporation can still pay eligible dividends if GRIP is available. However, if ERDTOH is already zero, those eligible dividends do not generate an ERDTOH refund.
Excess ERDTOH with no or insufficient GRIP If GRIP is zero or too small, the corporation cannot pay enough eligible dividends to recover all ERDTOH directly. In that case, remaining ERDTOH may be recovered through non-eligible dividend spillover, after NERDTOH is recovered first.
GRIP and ERDTOH do not always move together in real life In MayRetire’s simplified CCPC investment-account model, eligible Canadian dividends tend to increase both GRIP and ERDTOH-related refundable tax. In real corporate tax planning, GRIP can increase without a matching ERDTOH increase. MayRetire’s model is designed to support retirement projections for corporate investment portfolios, not all operating-company tax scenarios.
Practical guidance:

Figure 56: Main planning action buttons - Calculate, Stress Test, Simulate, Backtest
These commands run your plan using different analysis methods. Use
them together: start fast with Calculate, challenge the
plan with Stress Test, validate robustness with
Simulate, then test real history with
Backtest.
Calculate Quick deterministic projection using a constant-return assumption. Best for rapid iteration while adjusting inputs. It does not model year-to-year market randomness.
Simulate Monte Carlo analysis (500 scenarios) that introduces return variability and sequence risk. Use this as the primary realism check after baseline setup. Confidence level reflects the share of scenarios where your plan remains sustainable for the full horizon. In many plans, a more flexible withdrawal approach and a less aggressive asset mix can improve simulation success rates.
Stress Test Runs a curated set of fixed adverse scenarios against your current asset-allocation plan. Unlike Monte Carlo, these scenarios are not random. Unlike Backtest, they are not tied to one exact historical period. They are intentionally severe and can be more conservative than many Monte Carlo outcomes. Stress Test is available only when using detailed asset allocation (not the simple overall-return method).
Backtest Runs your plan through historical market regimes instead of randomized scenarios. Useful for stress testing against known high-inflation and severe drawdown periods. A depletion event in a historical path highlights vulnerability to that return sequence.
Note: Each button’s Learn more link opens focused
guidance for interpreting that method’s outputs and limitations.
The top-right action bar provides quick access to navigation, file operations, sharing, and account actions.

Figure 57: Top Action Bar icon row including Suggested Adjustments
Scroll to the top Jumps to the top of the page.
Scroll to the bottom Jumps to the bottom of the page.
Open MayRetire GPT Opens the MayRetire GPT assistant.
Suggest adjustments Opens the Suggested Adjustments workflow for the current plan. Detailed workflow is covered in Suggest Adjustments.
Open plan workspace Opens the Workspace panel above the plan inputs. The action is hidden while the Workspace is open. Detailed workflow is covered in Plan Workspace.
Compare retirement plans Loads one or more
.json plan files and opens plan comparison. Detailed
workflow is covered in Compare Plans.
Check Survivor Safety Visible only when planning for a couple and both start/end ages cross the age-75 safety check window. Runs survivor safety analysis. Detailed workflow is covered in Check Survivor Safety.
Load retirement parameters from a file Loads saved plan parameters from file and resets current results.
Save retirement parameters to a file Prompts for a file name, then saves current plan parameters as JSON.
Save calculator screenshot to a file Prompts for a file name, then captures and saves a full-page screenshot.
Create PDF report Prompts for a file name, then generates and saves a PDF report.
Send feedback Opens feedback flow to contact support.
Open Facebook page Opens the MayRetire Facebook page.
Open subreddit Opens the MayRetire subreddit.
Open home page Redirects to the MayRetire home page.
Sign Out Shows a confirmation dialog. On confirm, clears current saved plan state and signs out.
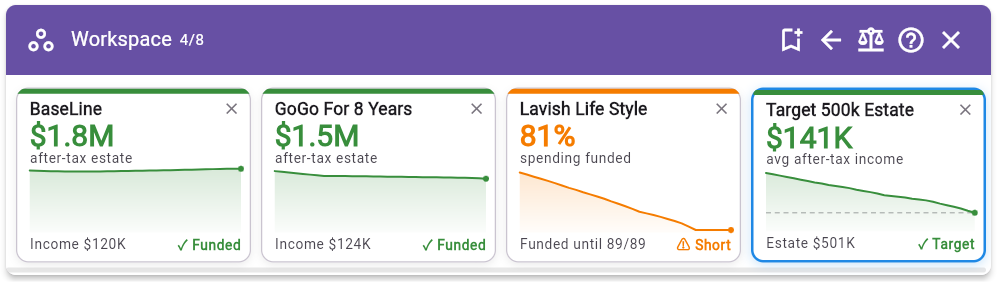
Figure 58: Plan Workspace with saved variants, outcome cards, and Workspace actions
The Workspace keeps related versions of a retirement plan together so you can explore alternatives without managing a separate file for every change. It is optional: you can continue using MayRetire as a single-plan calculator when the Workspace is closed. A Workspace can contain up to eight plans.
4/8.X in the Workspace header to hide the panel.
Closing the panel does not remove its plans.There are two ways to add a plan:
Variant 1..json plan file..json extension.Both actions are disabled when the Workspace reaches eight plans. Plan names must be non-empty and unique within the Workspace.
Each card summarizes one plan and its calculated outcome:
X on the card
removes that plan from the Workspace.The card with a blue border matches the plan currently shown in the input panels. If current inputs are edited so they no longer match a saved Workspace plan, no card is marked as current.
Select the balance icon in the Workspace header to open Compare Plans using the plans already in the Workspace.
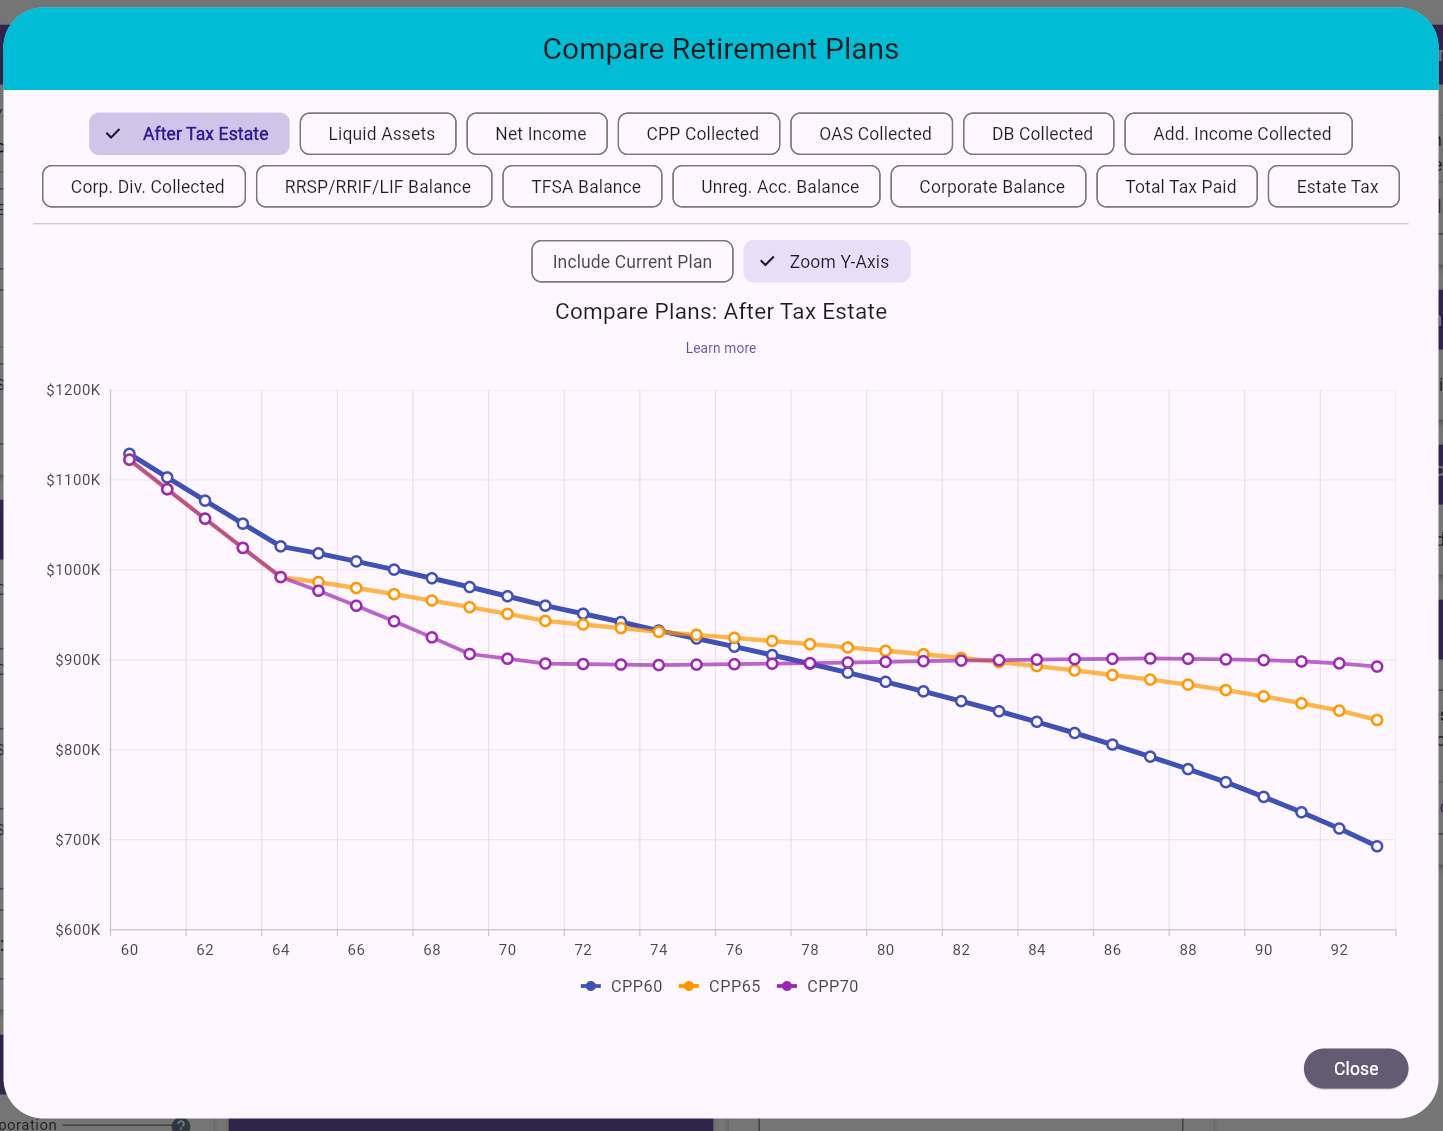
Figure 59: Compare Retirement Plans dialog with metric chips and multi-plan chart
Use this dialog to compare multiple saved plan scenarios against each other and optionally against your currently loaded plan.
.json plan files. You can
select 1 to 8 files.After Tax EstateLiquid AssetsNet IncomeCPP CollectedOAS CollectedDB CollectedAdd. Income CollectedCorp. Div. CollectedRRSP/RRIF/LIF BalanceTFSA BalanceUnreg. Acc. BalanceCorporate BalanceTotal Tax PaidEstate TaxPractical guidance:
CPP60, CPP65,
CPP70, etc.) so legend labels are immediately
meaningful.After Tax Estate, then review
Net Income and Total Tax Paid to understand
trade-offs.Zoom Y-Axis on for fine differences; turn it off
to evaluate absolute magnitude.
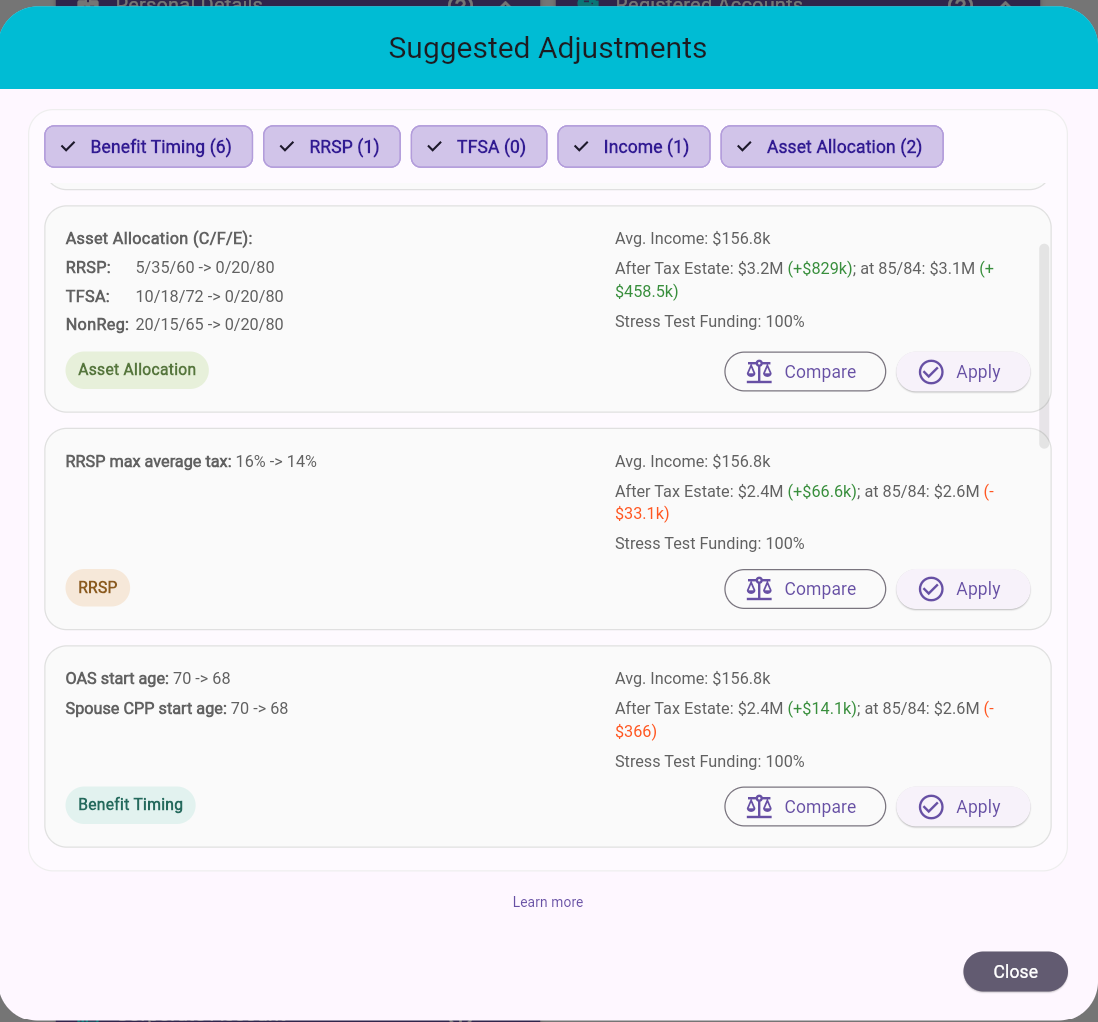
Figure 60: Suggested Adjustments dialog with category chips and adjustment cards
Suggested Adjustments helps surface a small set of potentially useful plan changes without running a full exhaustive optimization. This feature does not use AI to generate ideas. Instead, MayRetire evaluates targeted variations of your current plan and shows adjustments that appear promising enough to review.
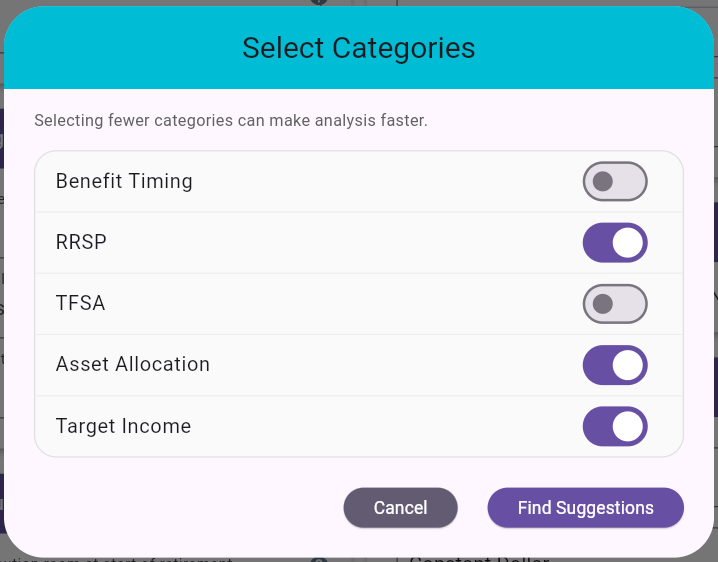
Figure 61: Select Categories dialog shown before generating suggestions
MayRetire opens Select Categories before generating suggestions so you can focus the search on the adjustment types you care about most.
Start the feature from the app’s Suggested Adjustments action.
MayRetire first opens Select Categories so you can choose which adjustment types to analyze.
After categories are chosen, MayRetire reviews the current plan and shows a progress dialog while generating possible adjustments.
If no suggestions are found for a narrowed category selection, MayRetire lets you reopen Select Categories and broaden the search.
If no suggestions are found even with all categories selected, MayRetire shows a simple no-adjustments message.
If suggestions are found, they are shown as cards inside the dialog.
Category chips at the top let you filter the list by suggestion type when multiple kinds of suggestions are present.
If not all categories were included in the search, the dialog also offers Select Categories so you can rerun with a different scope.
Compare
Apply
Yes, MayRetire opens Select
Categories again before rerunning the search.
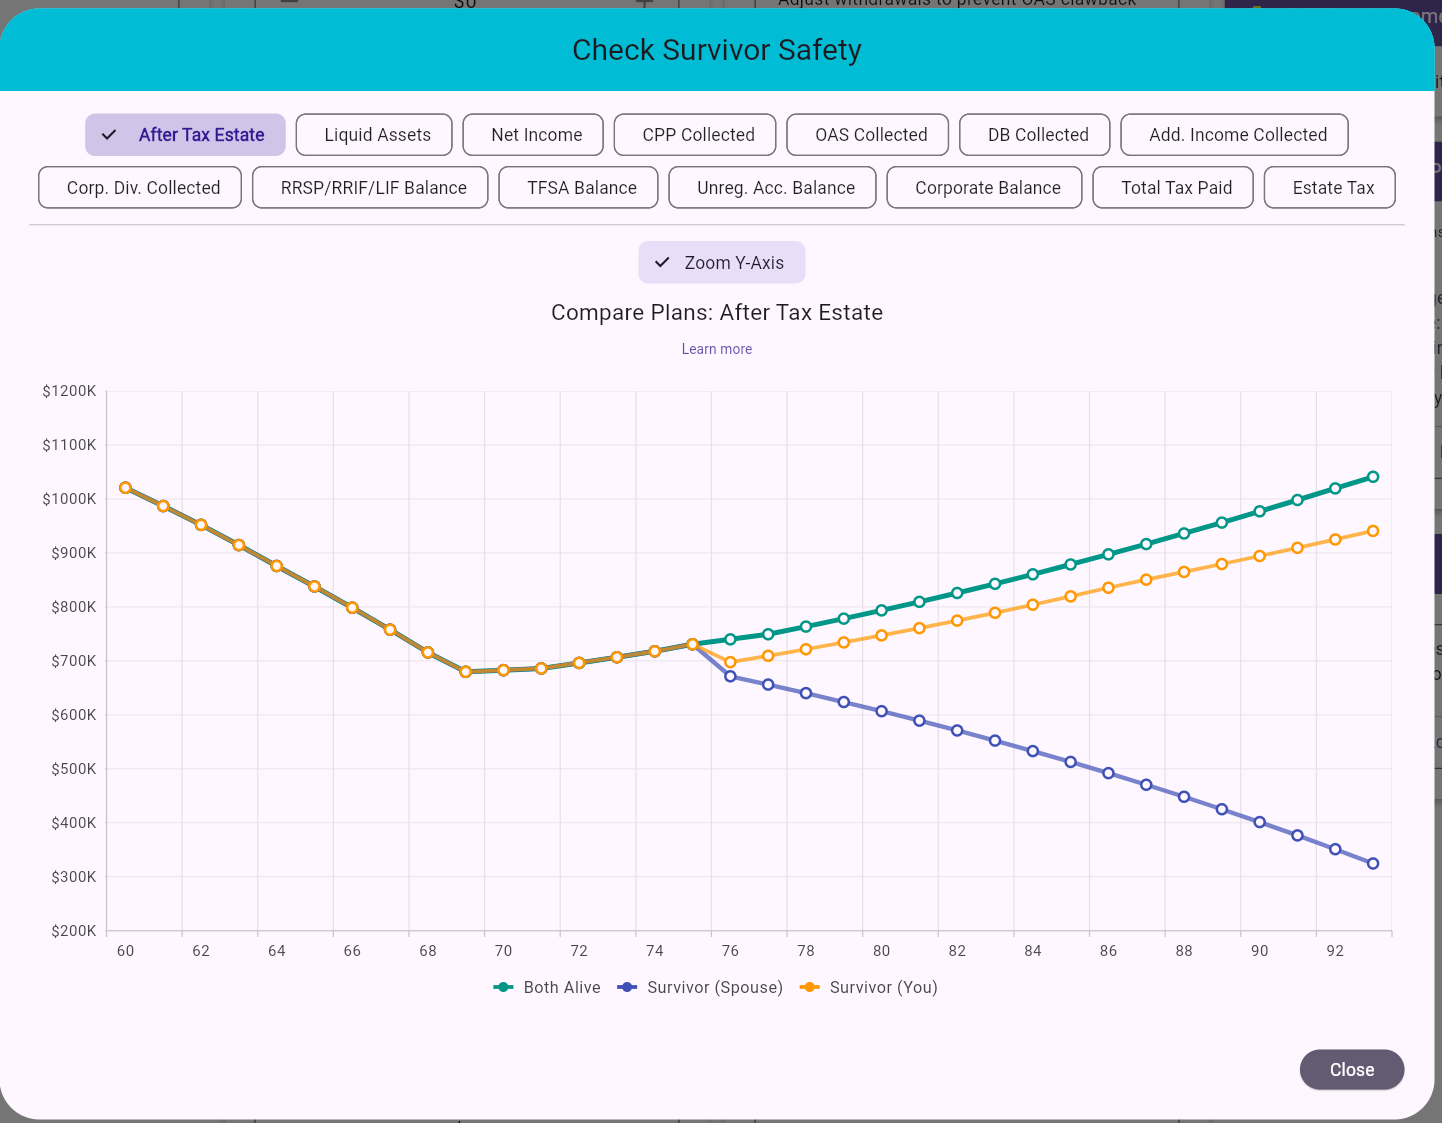
Figure 62: Check Survivor Safety dialog (Compare Plans framework with survivor scenarios)
This action reuses the Compare Plans charting framework, but instead of loading external files it auto-generates survivor scenarios to test household resilience.
Both Alive (base plan).Survivor (Spouse) (you pass away at age 75).Survivor (You) (spouse passes away at age 75).After Tax Estate, Liquid Assets,
Net Income, CPP Collected,
OAS Collected, DB Collected,
Add. Income Collected, Corp. Div. Collected,
RRSP/RRIF/LIF Balance, TFSA Balance,
Unreg. Acc. Balance, Corporate Balance,
Total Tax Paid, Estate Tax.Both Alive).Interpretation guidance:
Practical guidance:
After Tax Estate and Net Income
to confirm survivor sufficiency.This section documents the results area shown after running Calculate. The same results UI pattern is also reused in Stress Test, Simulate, and Backtest when you focus on a specific sequence or selected scenario.
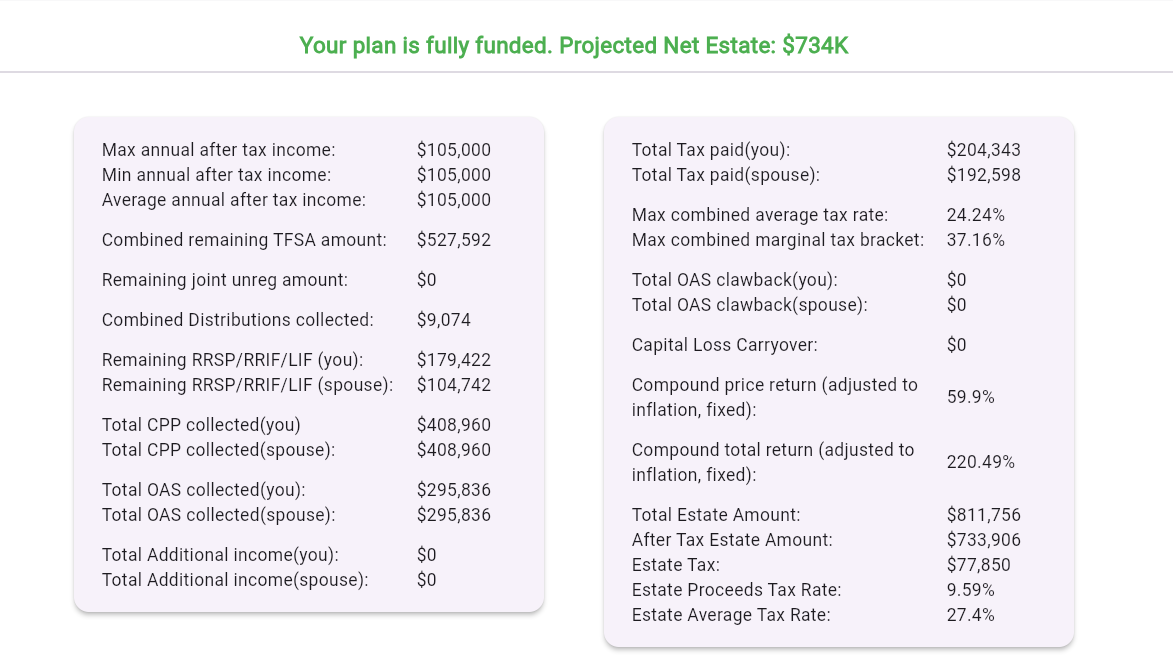
Figure 63: Fully funded outcome with projected net estate and summary cards
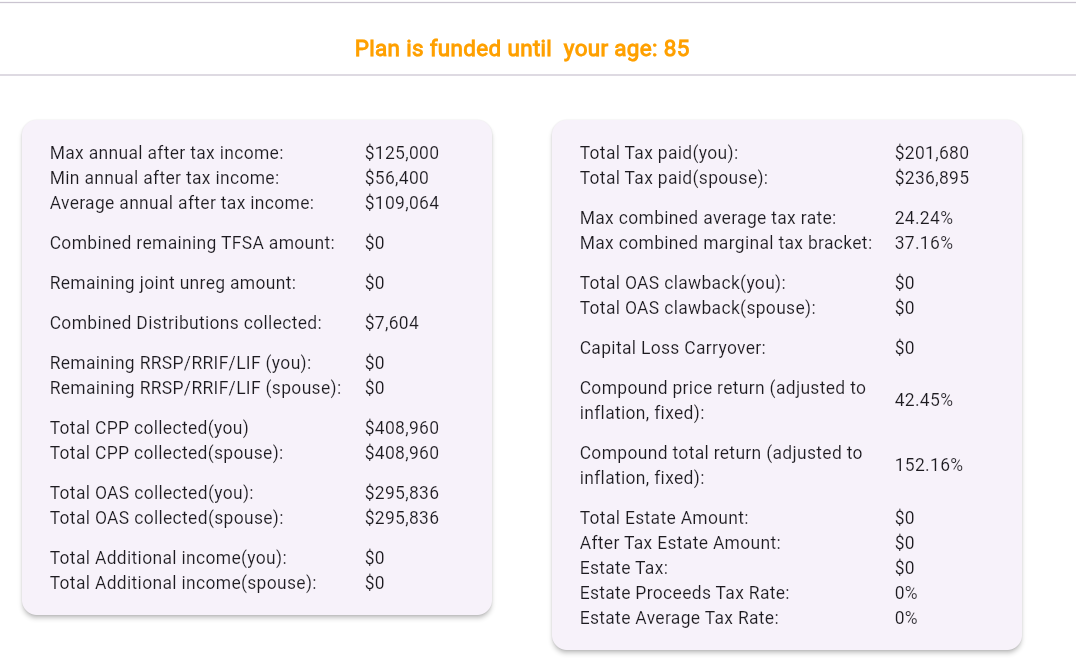
Figure 64: Partially funded outcome (funded until a specific age) with the same summary-card layout
The summary block provides a quick top-level diagnostic before you dive into charts or detailed yearly rows.
Left-side card (income/assets/benefits focus) includes:
Right-side card (tax/estate/returns focus) includes:
How to use this section effectively:
Min annual after tax income and
After Tax Estate Amount together to judge income stability
vs legacy outcome.This subsection will cover all results charts that appear below the
summary cards. Each chart will be documented in its own
sub-subsection (22.2.x) with:
Learn more guidance (when available).Charts show only relevant series MayRetire hides series that are not applicable to the current plan/scenario. Example: if no GIS is received in the plan, a GIS series will not be shown.
Toggle series from legend Click a legend item to show/hide that series. Use this to isolate one account, one spouse, or one metric line.
Hover for exact values Move the cursor over chart points to see detailed values for that specific year/age.
Collapse/expand chart sections Use the chart section chevron to collapse charts you are not using and expand them again when needed.
Use chart-specific Learn more links
Most charts include a Learn more action that explains
intent and interpretation nuances.
Read trends, not only endpoints Two plans can finish similarly but differ substantially in mid-retirement stress years.
Use complementary views Charts, summary cards, and the detailed projections table present the same plan through different lenses: trend view, headline metrics, and year-by-year detail.
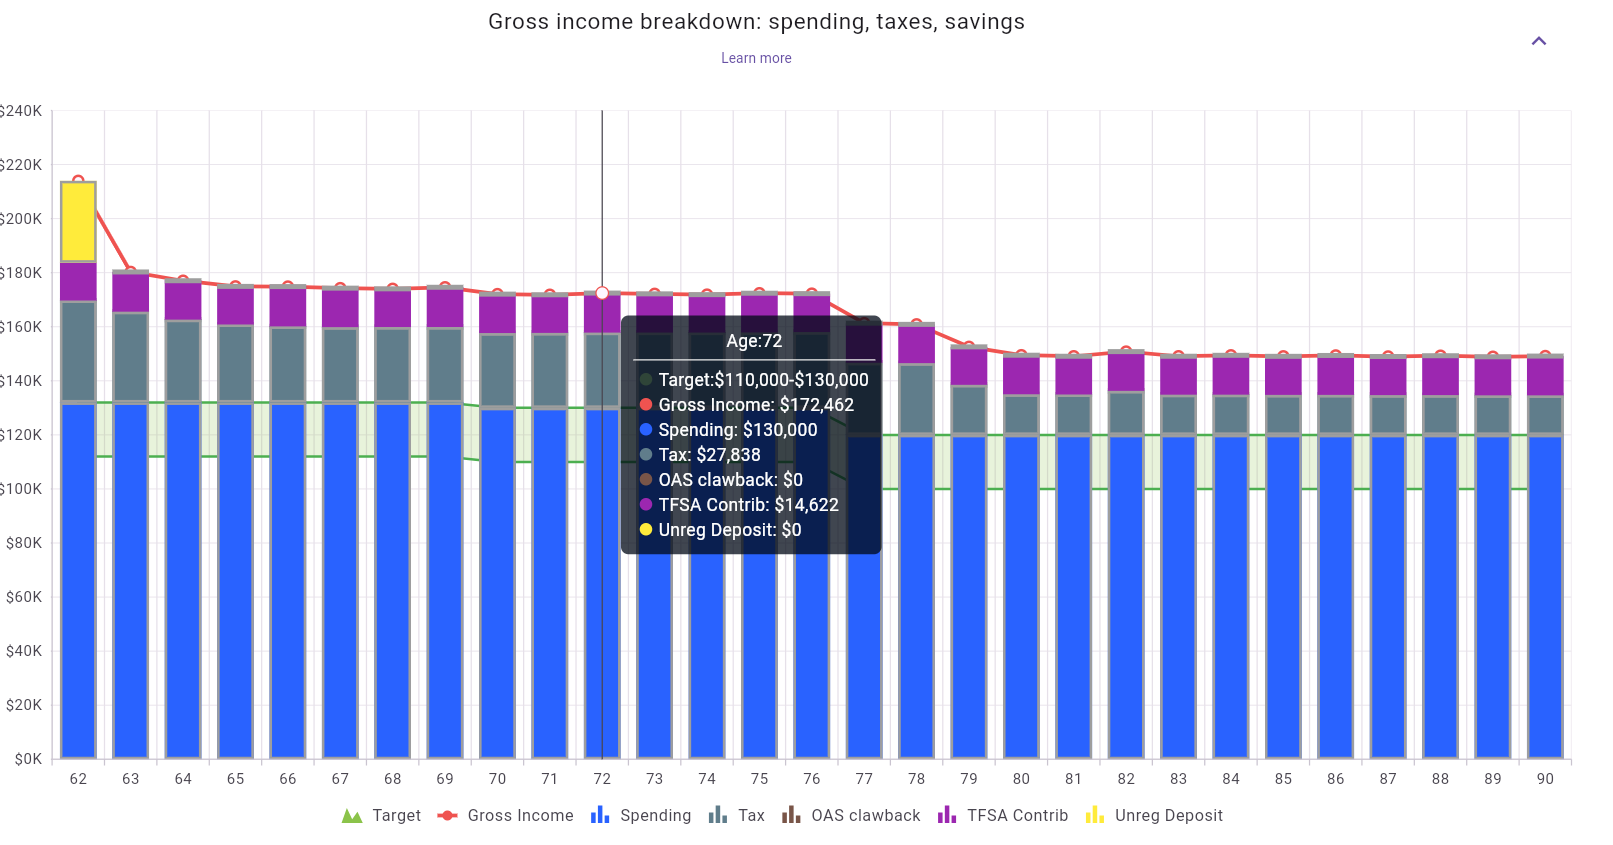
Figure 65: Gross income breakdown chart (spending, taxes, OAS clawback, savings)
What this chart shows:
How to read it:
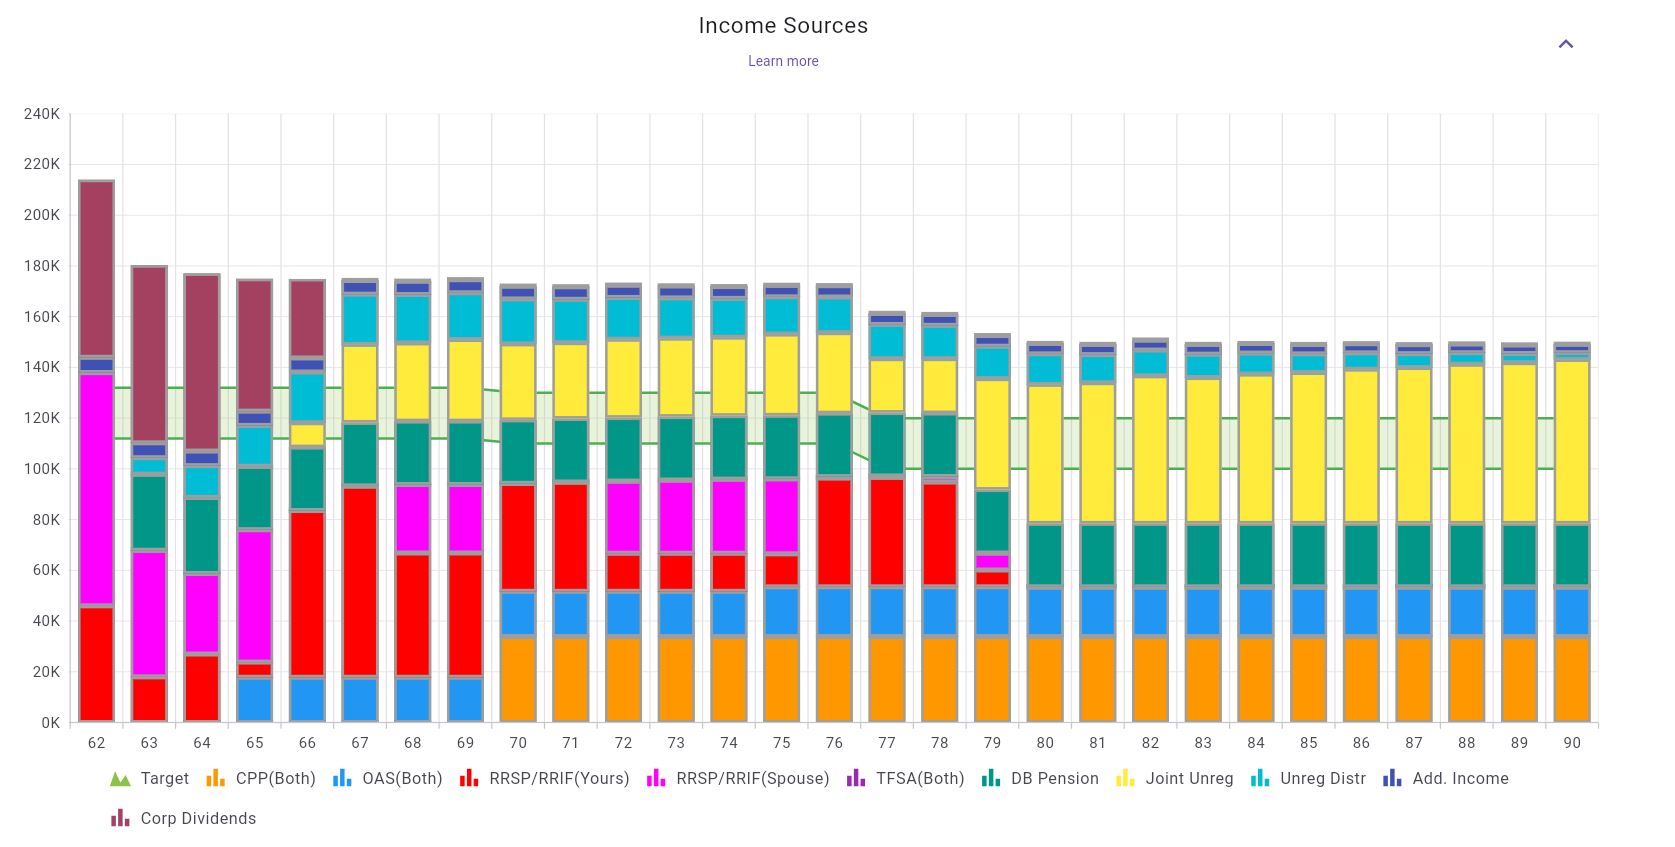
Figure 66: Income Sources chart (stacked annual income by source plus target line)
What this chart shows:
How to read it:
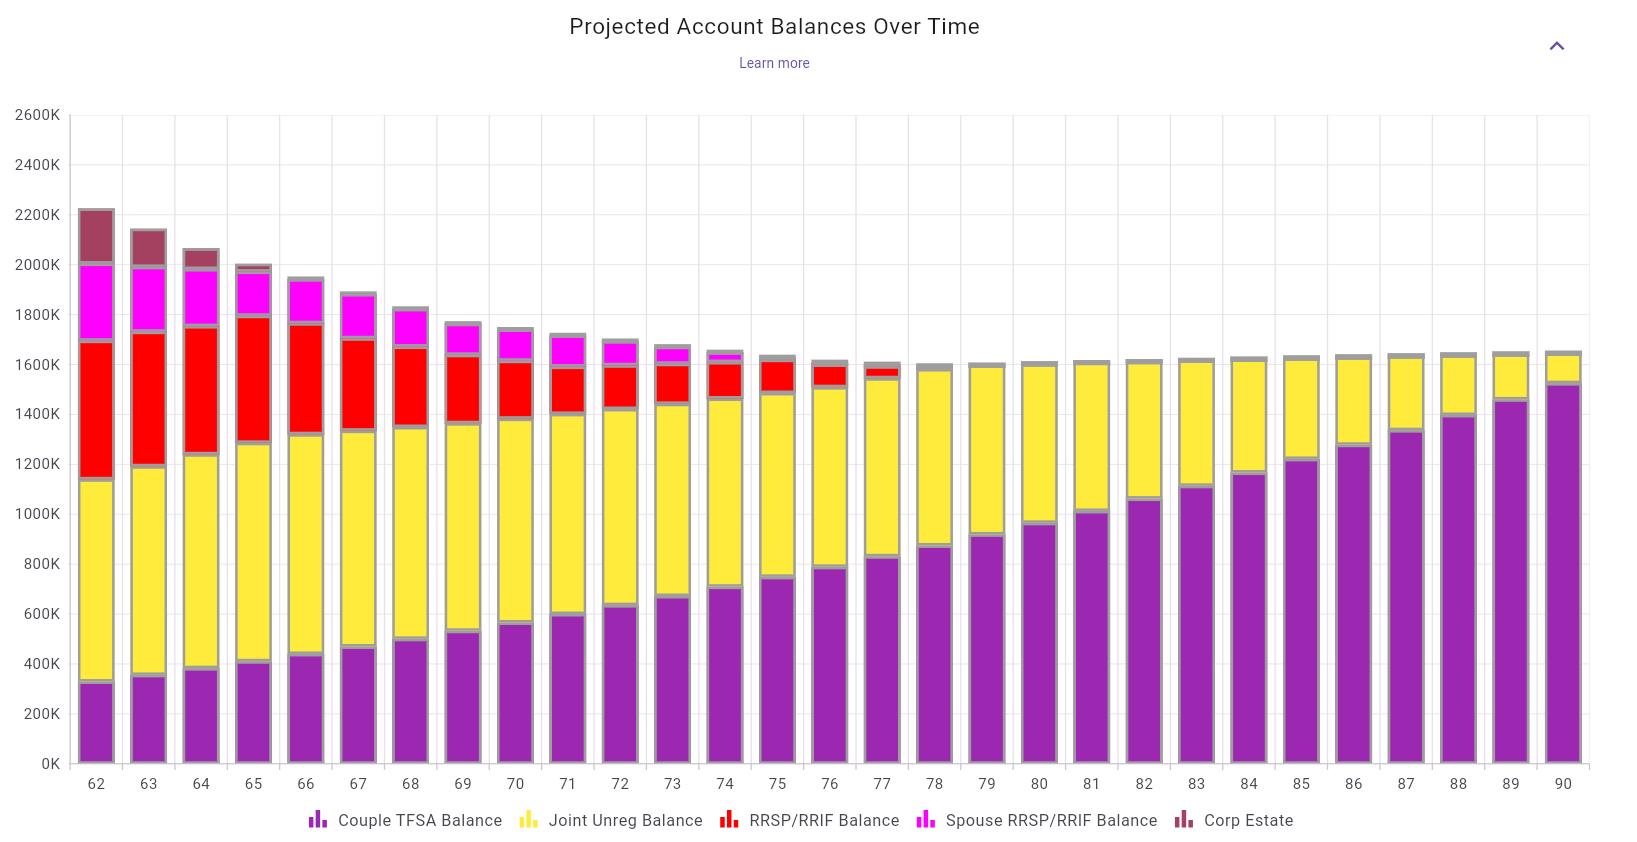
Figure 67: Projected account balances over time (stacked by account type)
What this chart shows:
How to read it:
This chart appears when the plan includes investment portfolios. It provides a more detailed view of taxable non-registered assets than the overall account-balance chart.
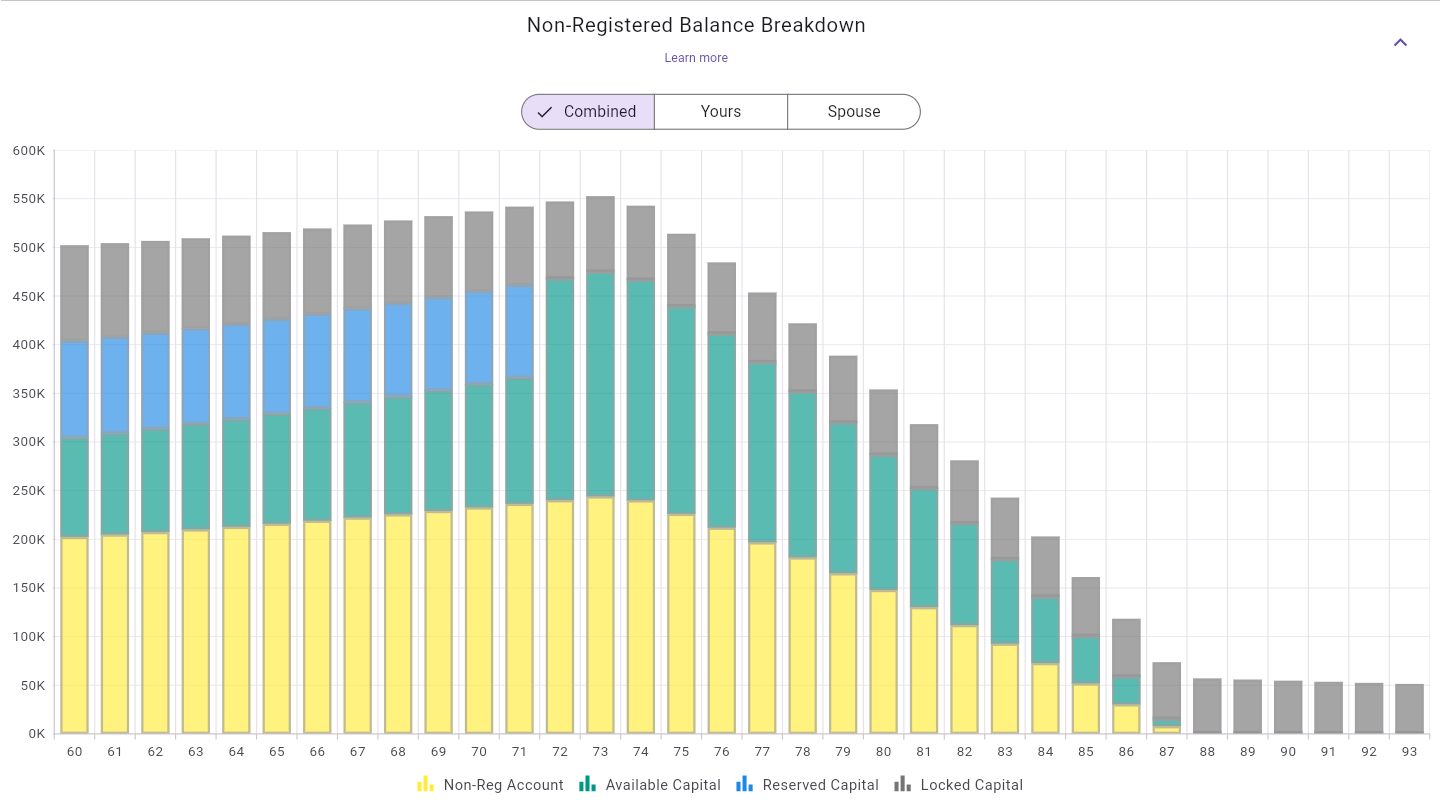
Figure 68: Non-registered balance breakdown by account and portfolio capital access
What this chart shows:
Non-Reg Account balance.Available CapitalReserved CapitalLocked CapitalCombined, Yours, and Spouse.How to read it:
Combined to understand total taxable non-registered
wealth.Yours and Spouse to inspect
attribution and survivor-sensitive ownership patterns.Interpretation guidance:
This chart block is available for couple plans, where cross-spouse taxable attribution and splitting effects can be shown.
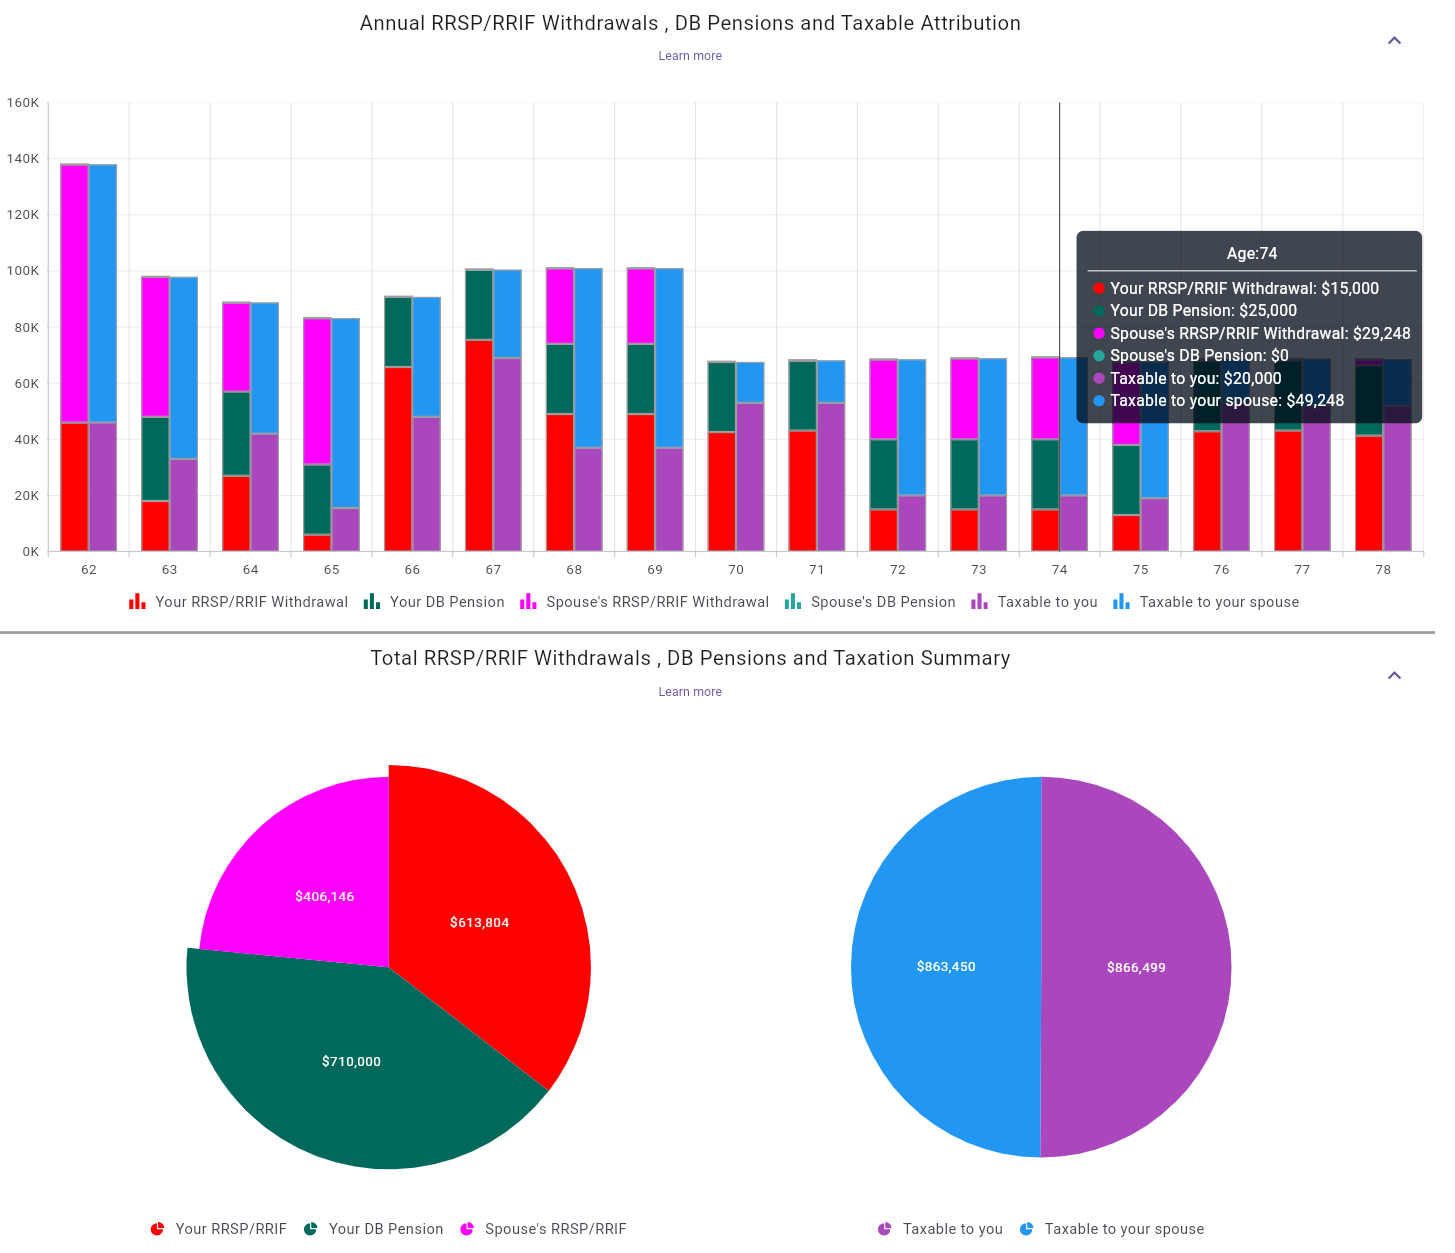
Figure 69: Annual attribution chart (top) and total-withdrawal/taxation summary pies (bottom)
What this chart block shows:
How to read it:
Interpretation note for this example:
This chart appears only when at least one donation is configured in the plan.
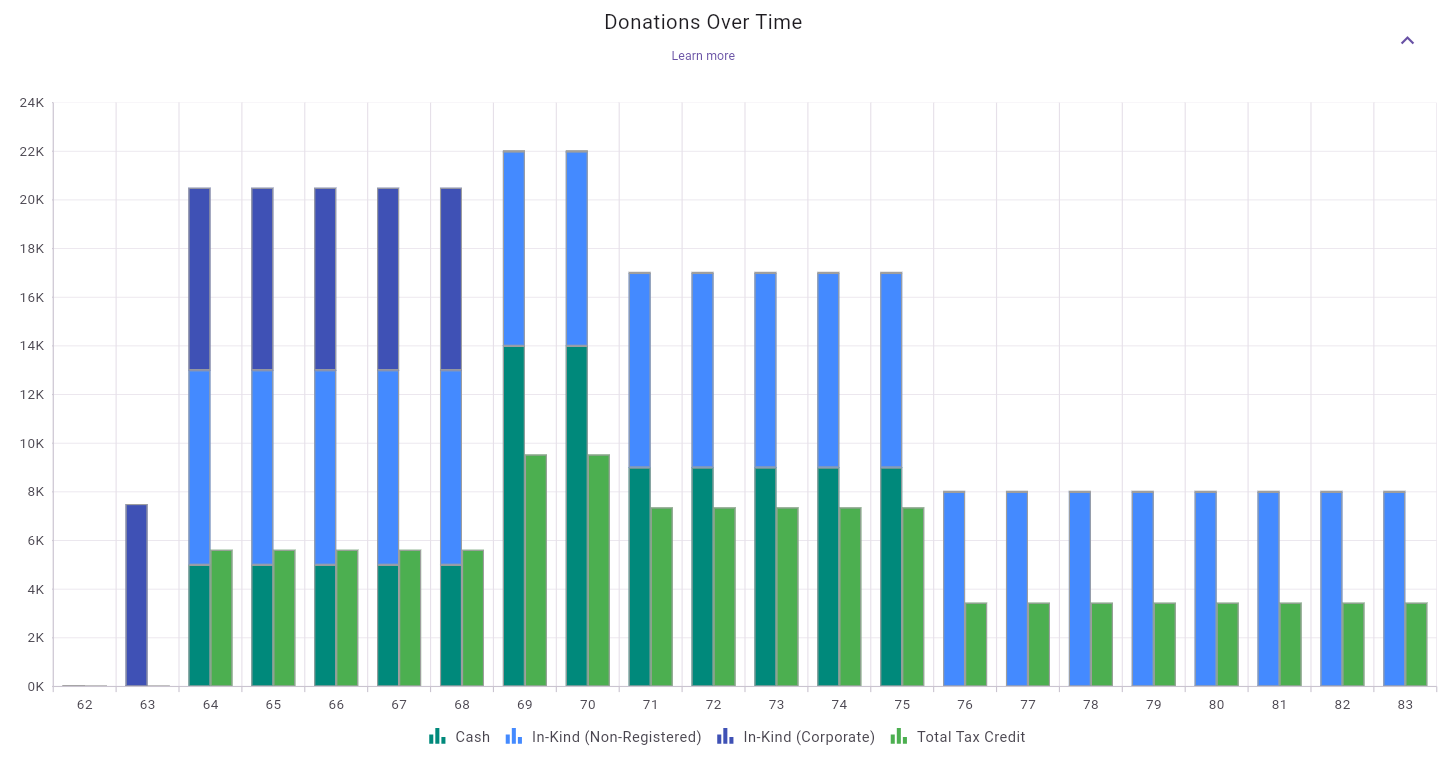
Figure 70: Donations chart with stacked funding types and total tax credit
What this chart shows:
CashIn-Kind (Non-Registered)In-Kind (Corporate) when applicableTotal Tax Credit series when the plan includes personal
donations that generate donation tax credits.How to read it:
Interpretation guidance:
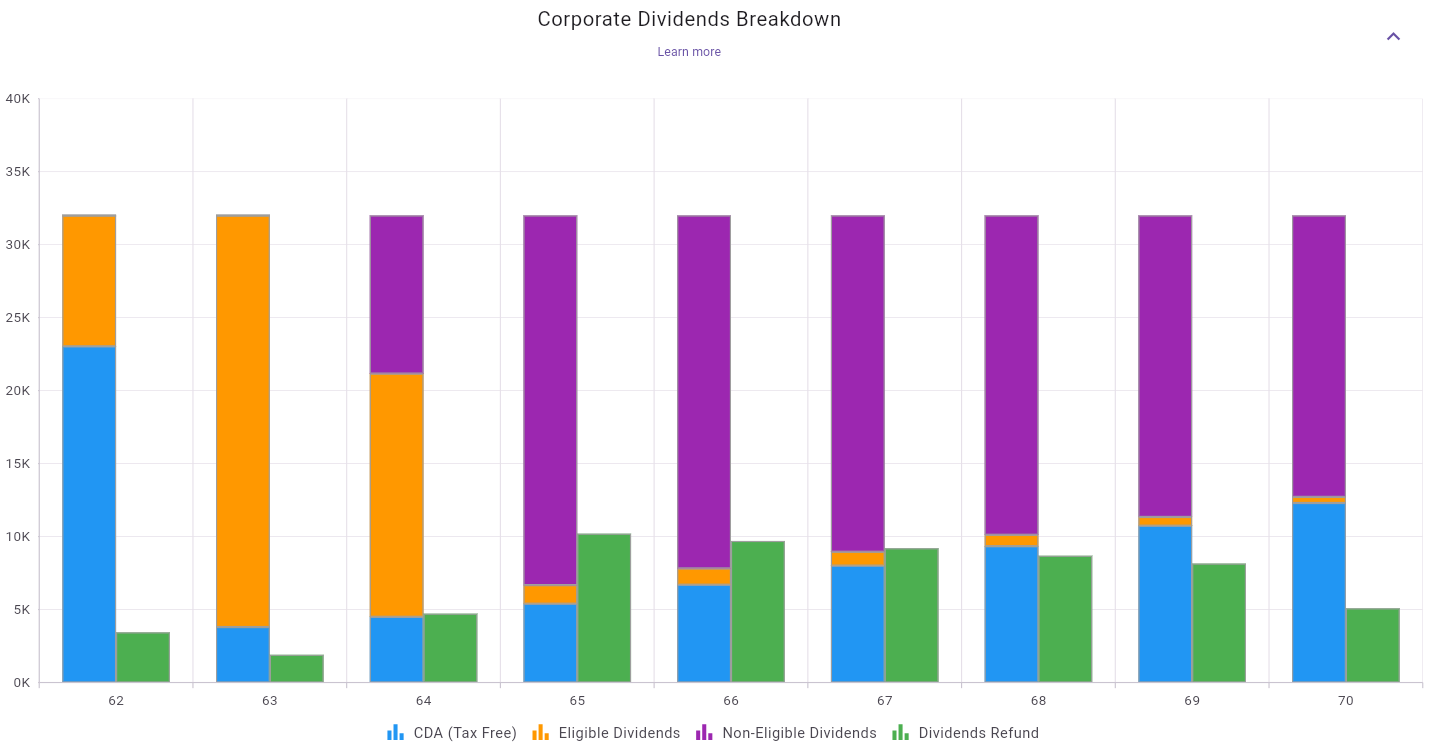
Figure 71: Corporate dividends composition and refundable-tax flow over time
What this chart shows:
CDA (Tax Free)Eligible DividendsNon-Eligible DividendsDividends Refund series showing refundable-tax recovery
flow (RDTOH refund effect).How to read it:
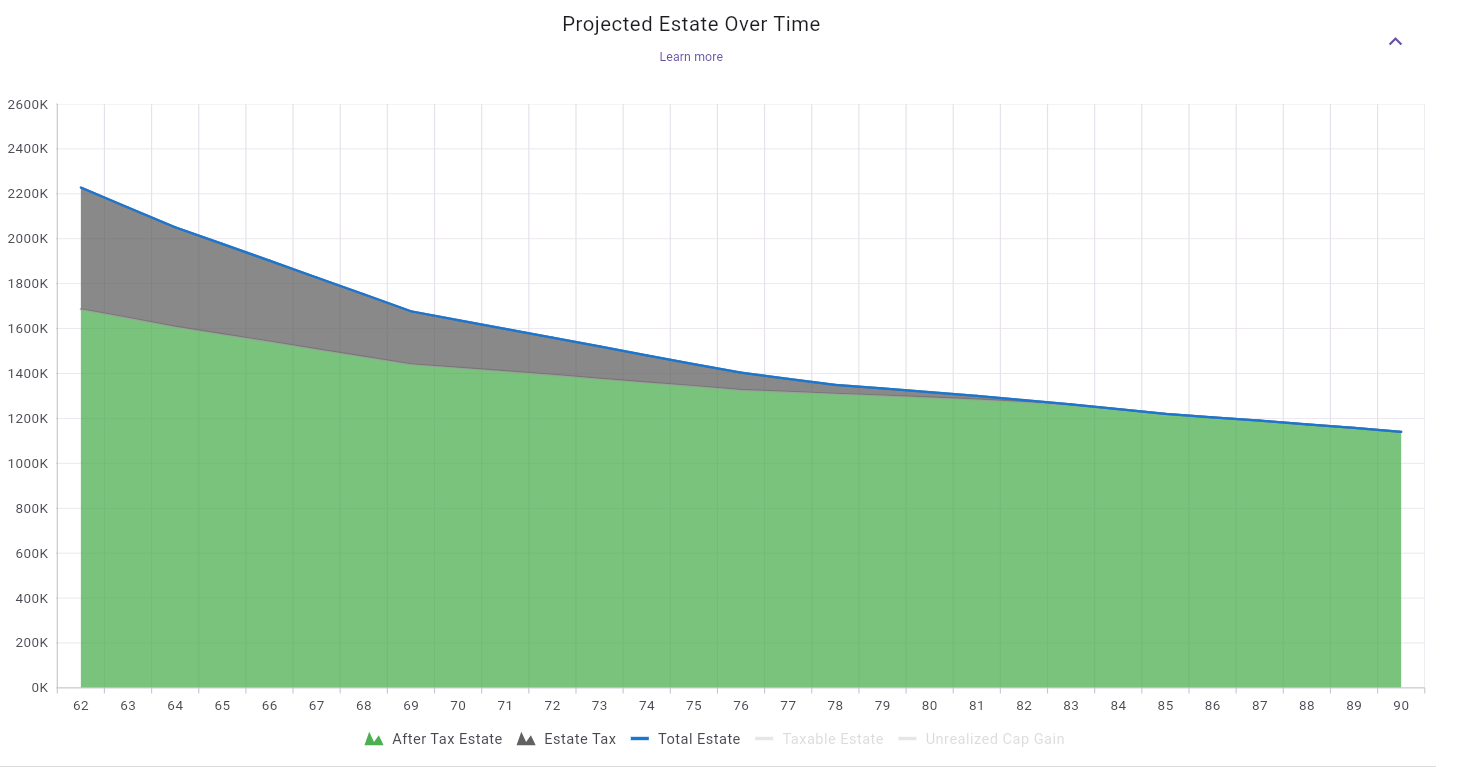
Figure 72: Projected estate over time (total, after-tax, and estate-tax components)
What this chart shows:
After Tax EstateEstate TaxTotal EstateHow to read it:
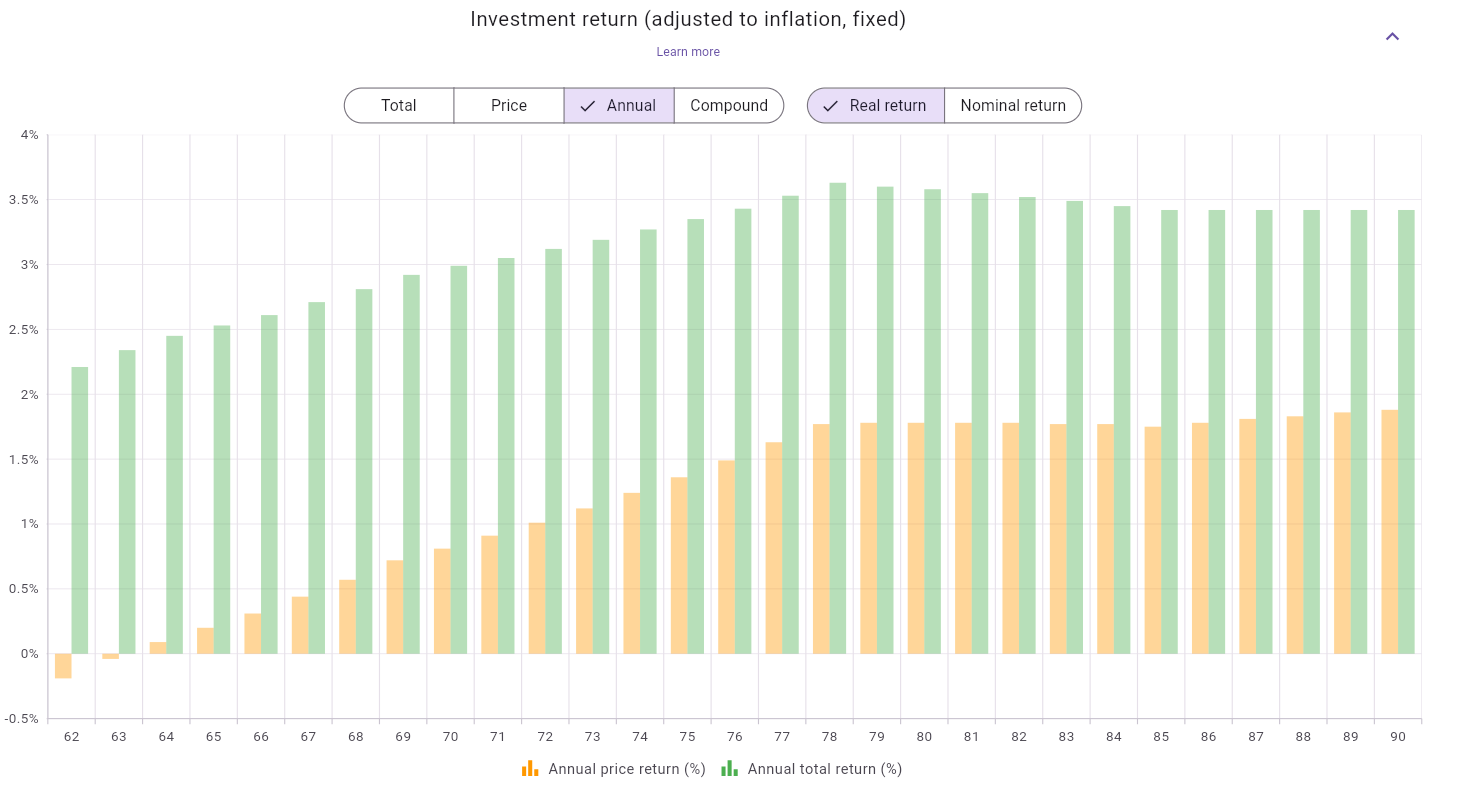
Figure 73: Investment return chart in Annual + Real-return view
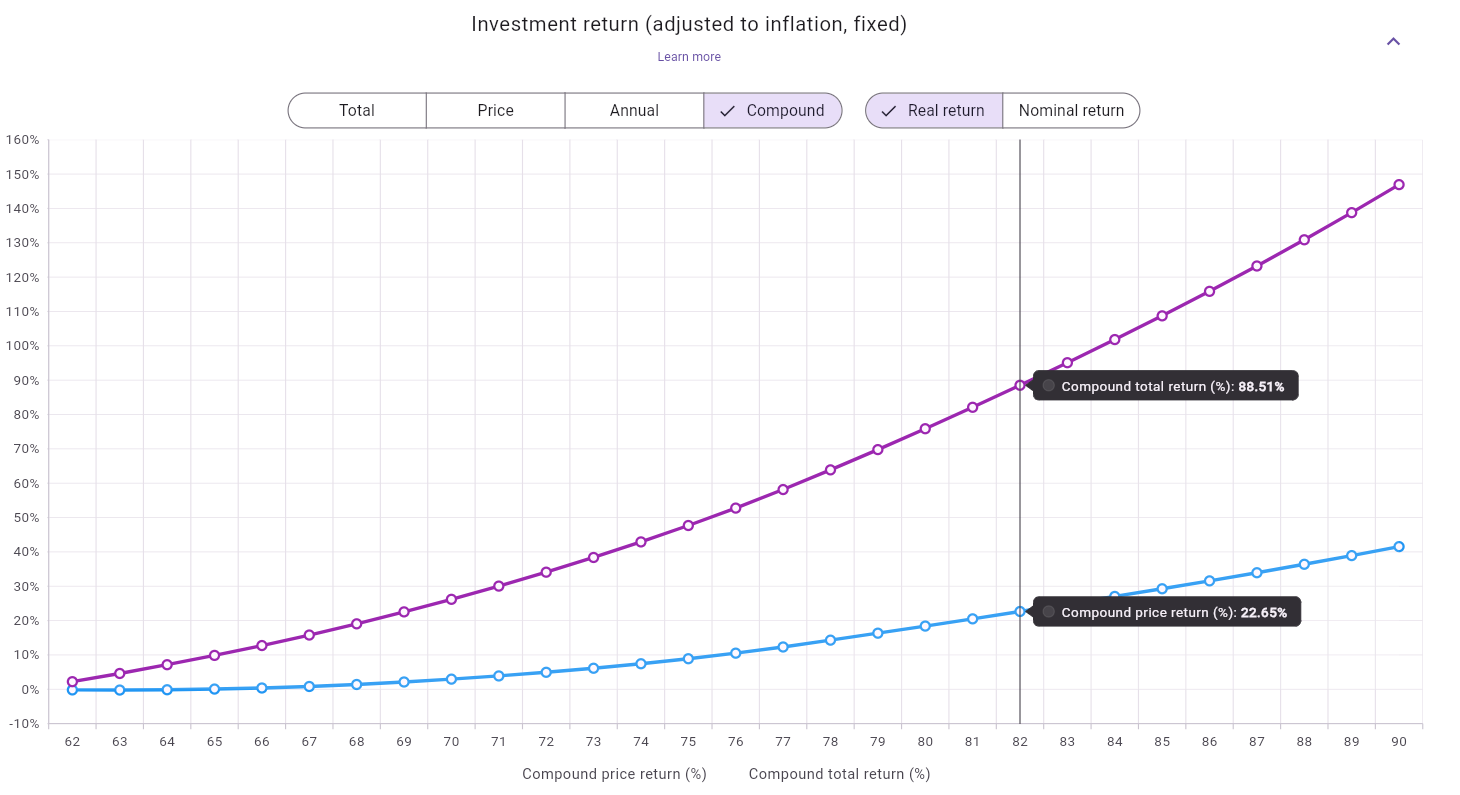
Figure 74: Investment return chart in Compound + Real-return view
What this chart shows:
Total or
PriceAnnual or
CompoundReal return
(inflation-adjusted) or Nominal returnHow to read the two views shown:
Interpretation guidance:
Price vs Total to understand the
role of distributions/dividends in overall growth.
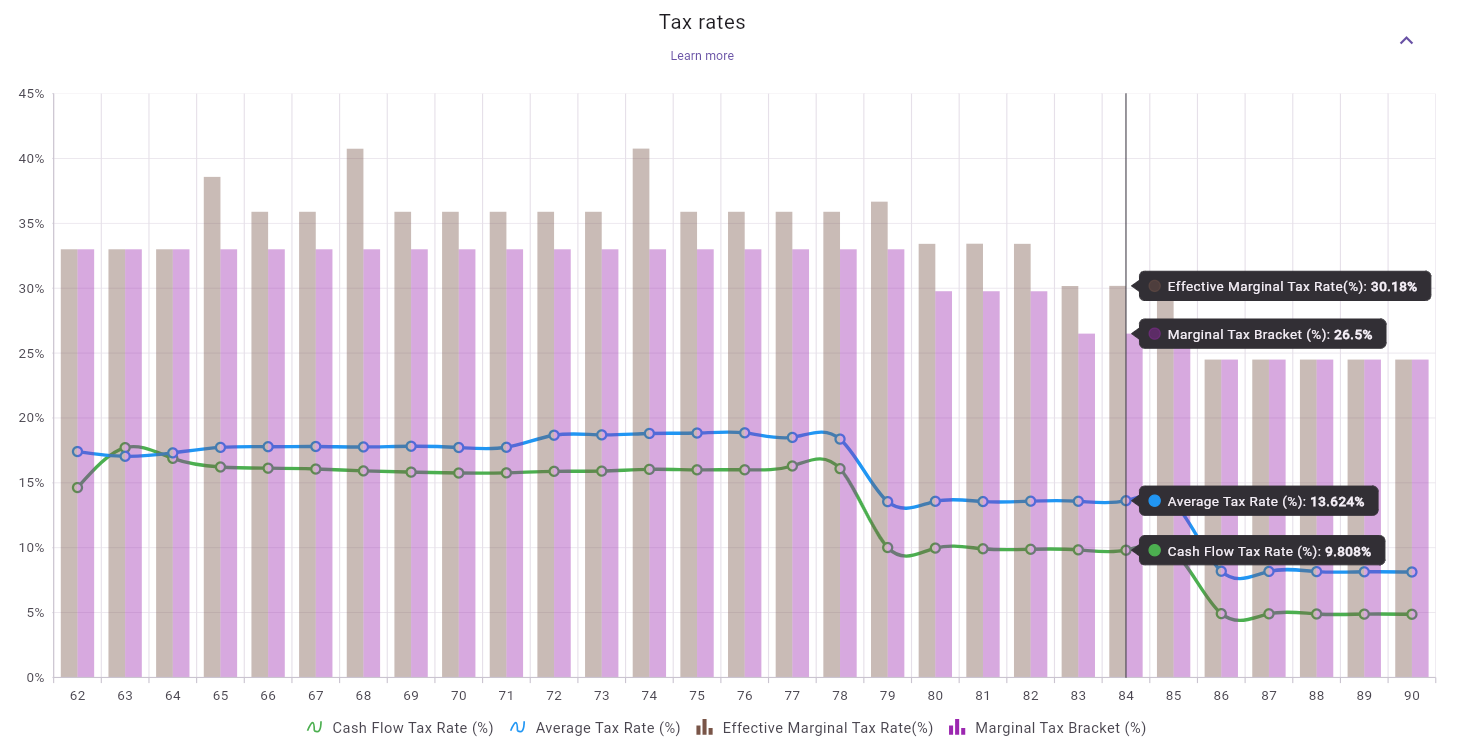
Figure 75: Tax rates chart (cash-flow, average, effective marginal, and bracket rates)
What this chart shows:
Cash Flow Tax Rate (%)Average Tax Rate (%)Effective Marginal Tax Rate (%)Marginal Tax Bracket (%)How to read it:
Interpretation guidance:
This chart appears only when at least one rental property is configured in the plan.
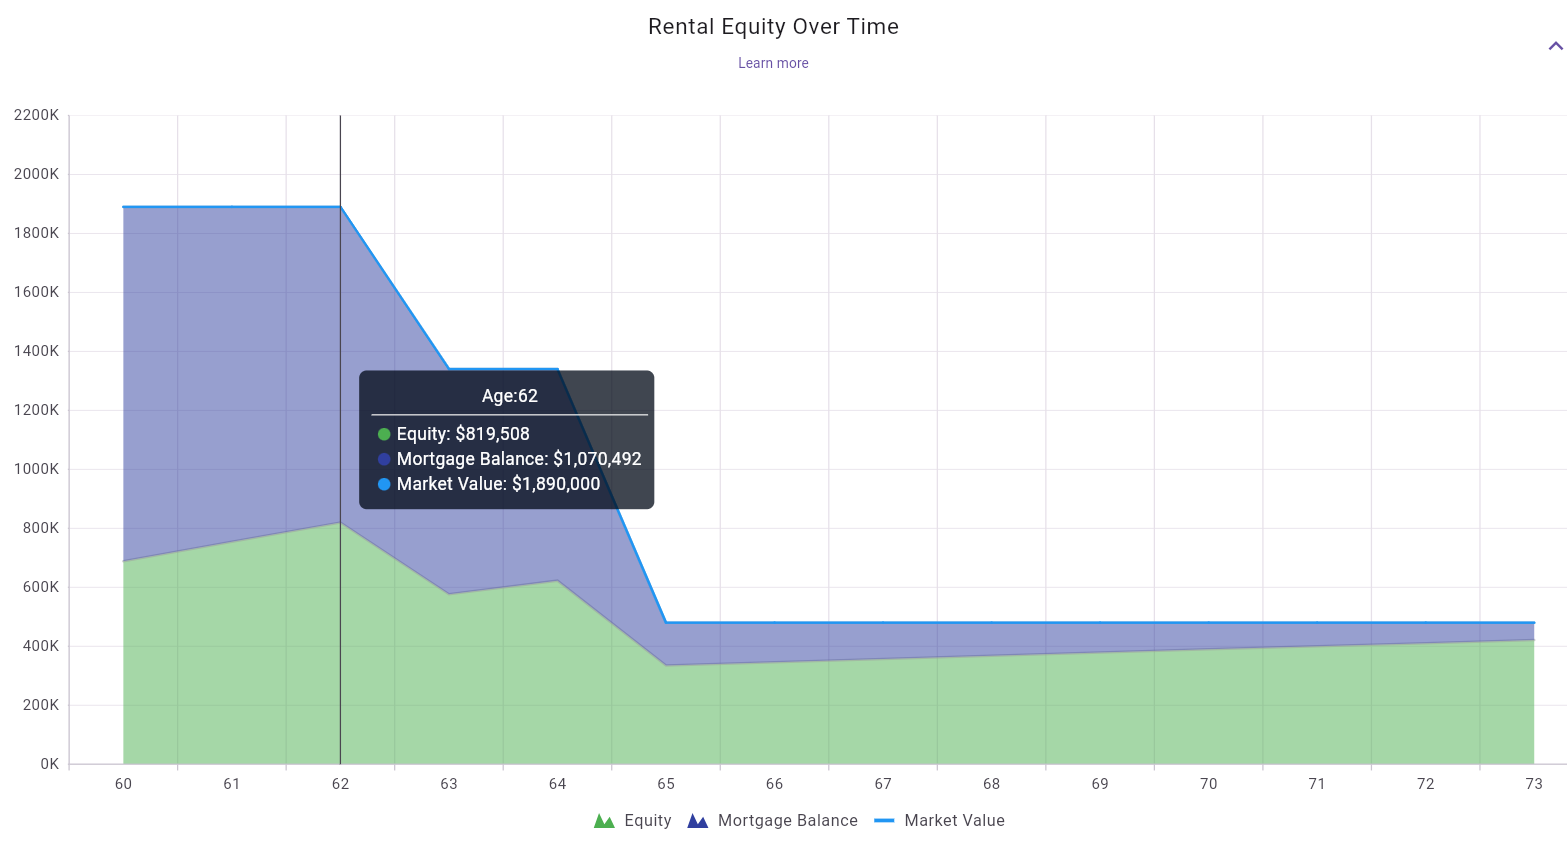
Figure 76: Rental equity chart (market value, mortgage balance, and resulting equity)
What this chart shows:
Market ValueMortgage BalanceEquityHow to read it:
Interpretation guidance:
This chart appears only when at least one rental property is configured in the plan.
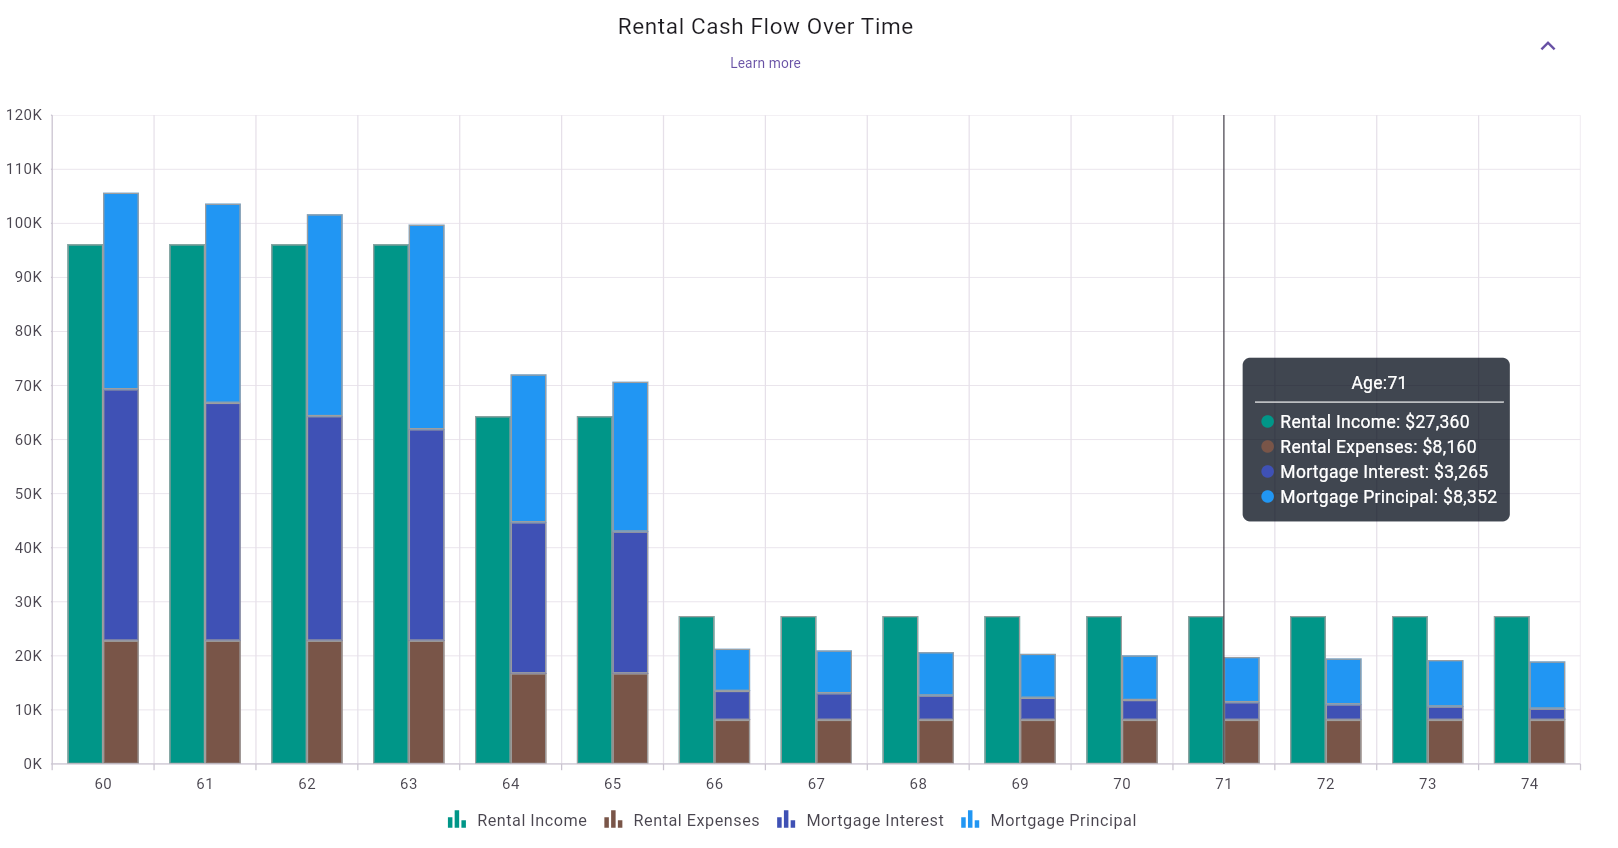
Figure 77: Rental cash-flow chart (income, expenses, mortgage interest, and mortgage principal)
What this chart shows:
Rental IncomeRental ExpensesMortgage InterestMortgage PrincipalHow to read it:
Interpretation guidance:
The detailed table is the year-by-year numeric companion to the summary cards and charts. It lets you inspect exact values for each age and each major planning component.
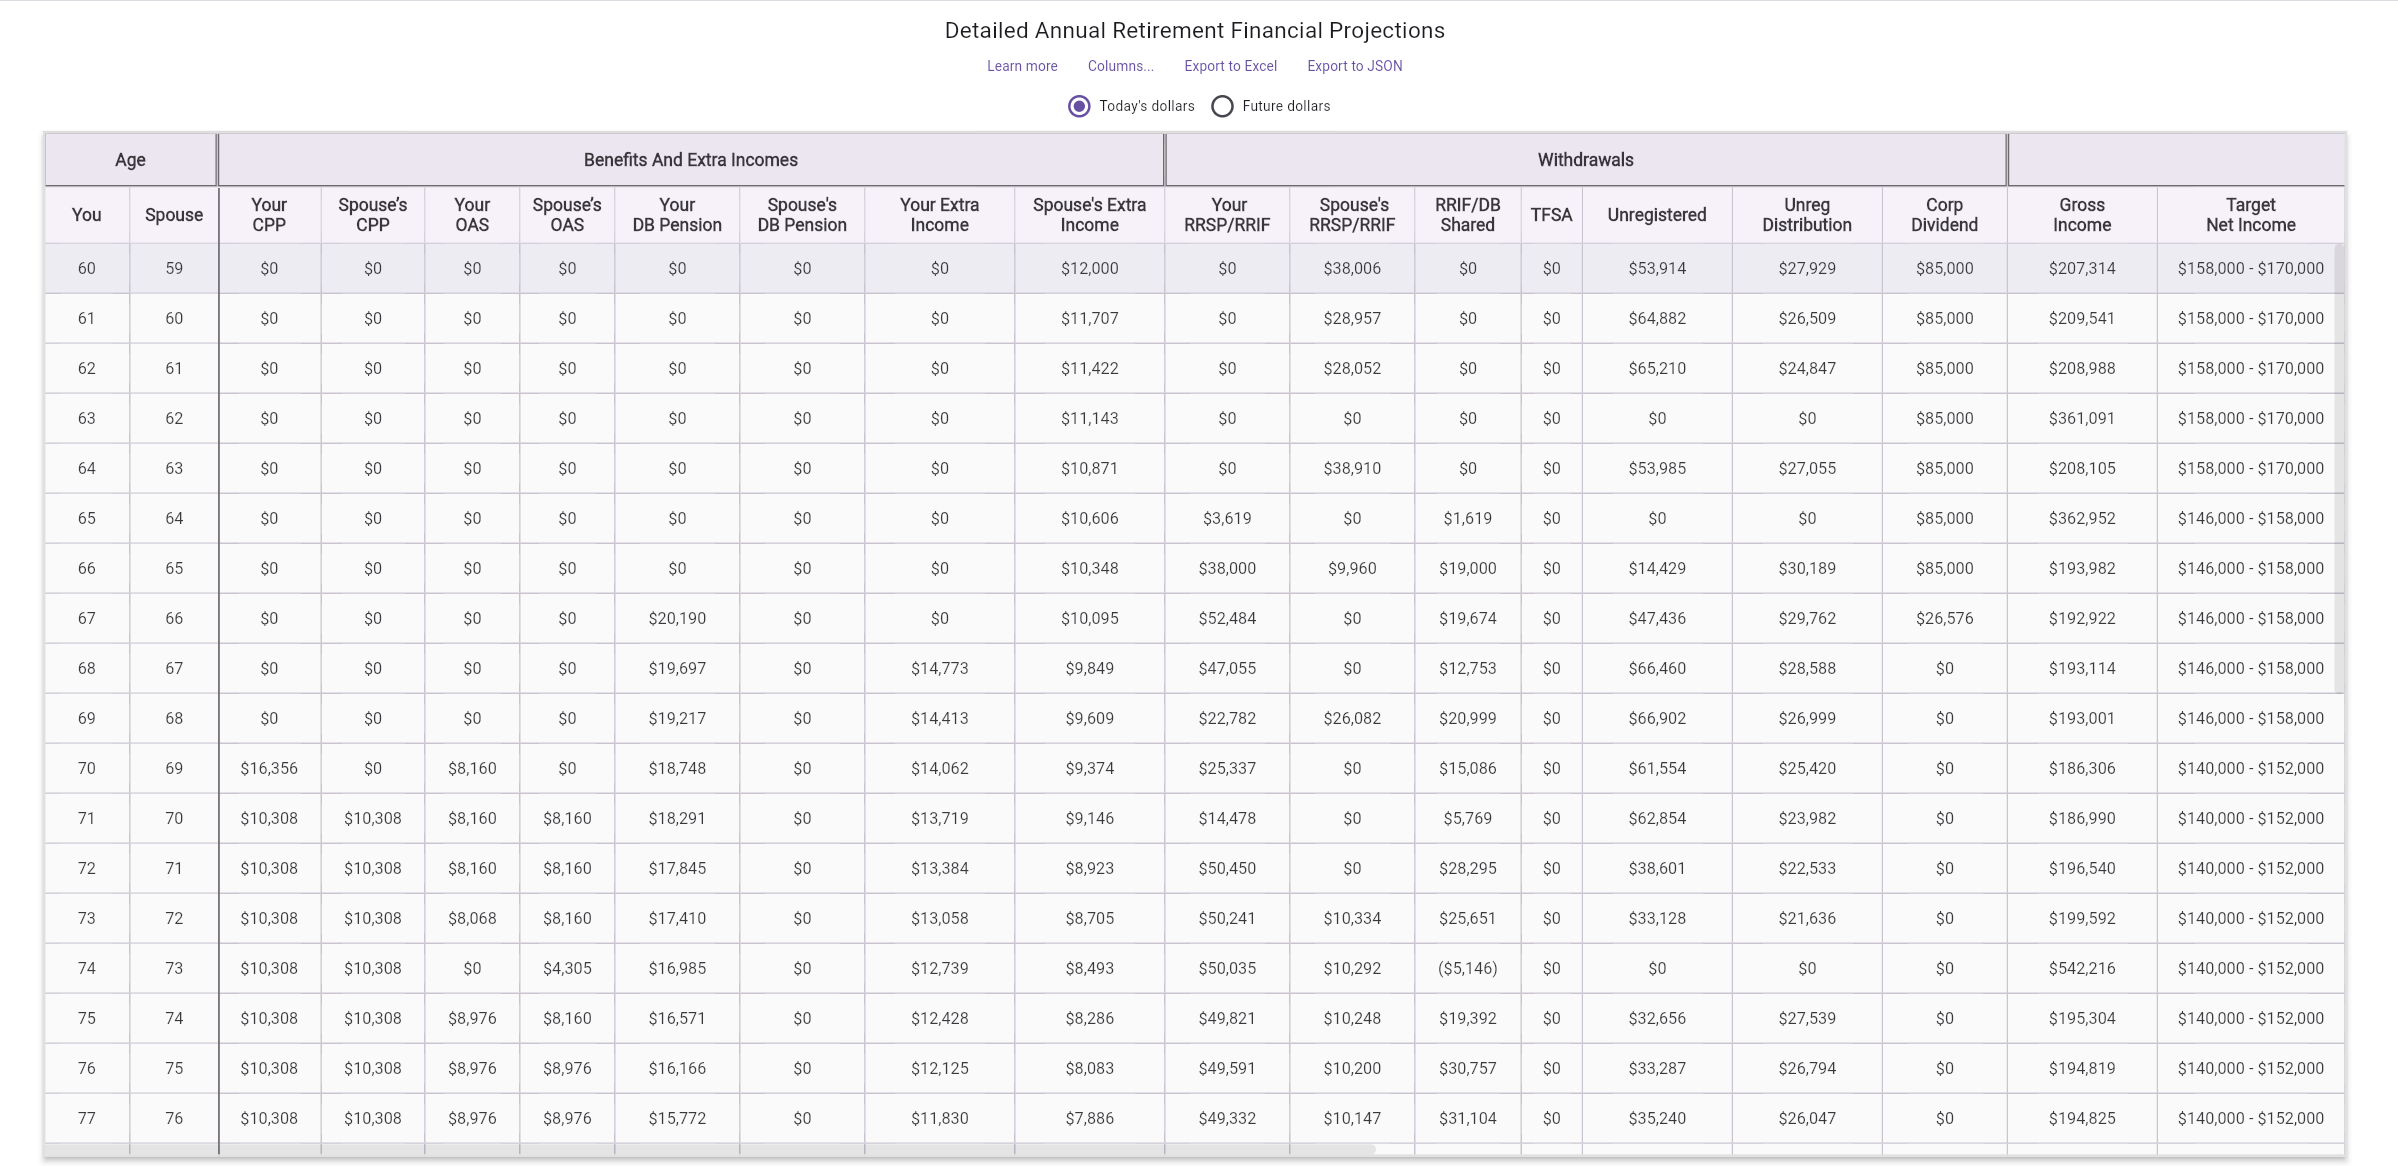
Figure 78: Detailed annual retirement financial projections table with grouped columns and top actions
What this section shows:
Top actions above the table:
Columns...: open the column-group picker to simplify
the view.Export to Excel: download the projections for
spreadsheet analysis and sharing.Export to JSON: download structured projection data for
integrations or custom analysis.Today's dollars / Future dollars: switch
display basis to inflation-adjusted or nominal-dollar views.Usage tips:
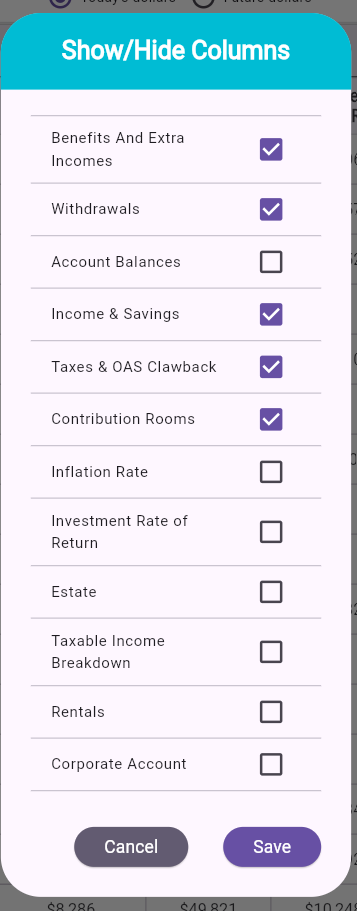
Figure 79: Show/Hide Columns dialog for selecting table column groups
What this dialog does:
Typical workflow:
The Annual Tax Report is a worksheet-style companion to the detailed projections table. It focuses on tax computation rather than account balances or withdrawal mechanics, making it easier to review deductions, credits, surtax, health premium, and total tax payable across the retirement timeline.
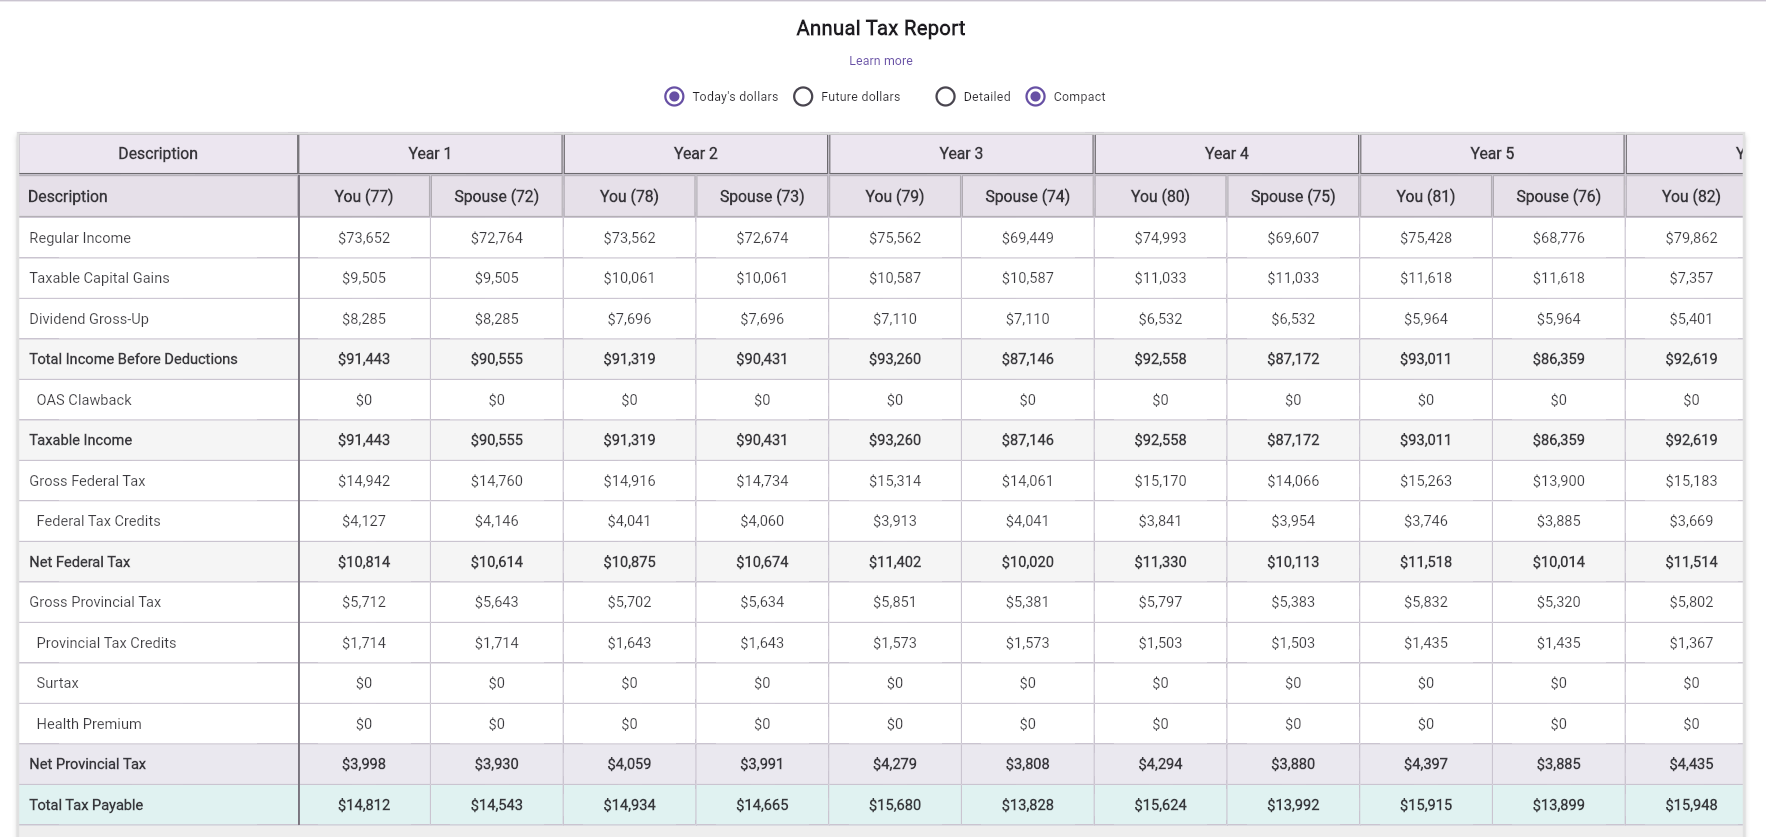
Figure 80: Annual tax report with year-grouped columns, per-person values, and detailed or compact tax views
What this section shows:
You and
Spouse while both are alive.Age: N.Controls above the table:
Learn more: opens contextual help for interpreting the
report.Today's dollars / Future dollars: changes
only the tax report display basis, independently from the detailed
projections table.Detailed / Compact: switches between a
fuller tax audit view and a shorter summary view.Export to Excel: downloads the currently selected tax
report view for spreadsheet review, using the chosen
Today's dollars / Future dollars basis and
Compact, Standard, or Detailed
mode.What the rows cover:
Total Tax Payable.Usage tips:
Detailed when validating how credits and add-ons
affect tax.Compact when scanning many years side by side.MayRetire can evaluate multiple RRSP/RRIF withdrawal strategies for the currently selected return sequence and show the outcome tradeoffs side by side.

Figure 81: Entry link to evaluate RRSP withdrawal strategies for the active sequence
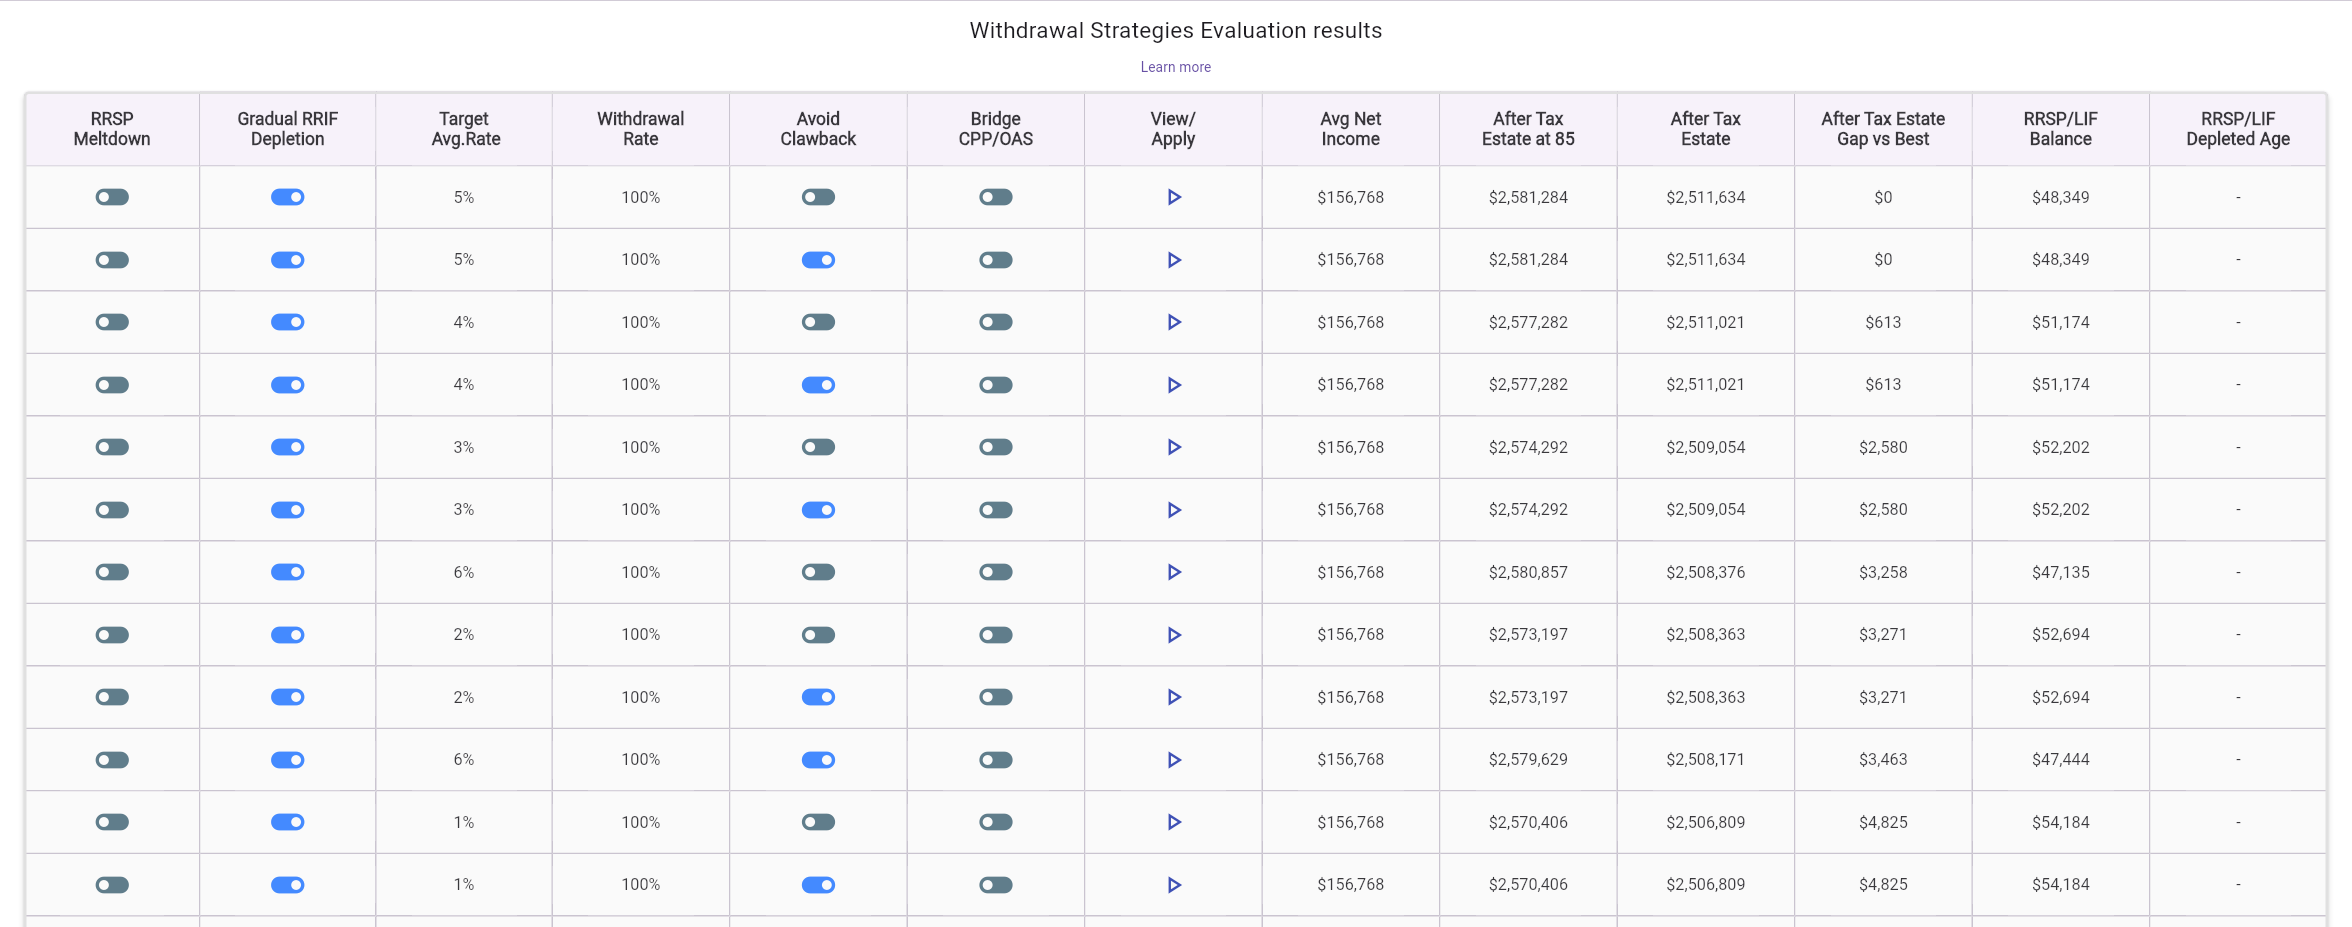
Figure 82: Withdrawal strategy evaluation table with strategy settings and key outcome metrics
How it works:
Evaluate different withdrawal strategies for this sequence of returns.View/Apply on any row to load that strategy and
immediately inspect its full output in charts and the detailed annual
projections table for the same sequence.What the evaluation table includes:
RRSP Meltdown,
Gradual RRIF Depletion, target average tax rate, withdrawal
rate, OAS-clawback handling, and CPP/OAS bridge options).When to use it:
Stress Test runs a small curated set of fixed adverse market regimes and shows how your plan behaves under each one. The goal is not to estimate probability. The goal is to pressure-test the plan against a handful of deliberately difficult environments that are easy to interpret and compare.

Figure 83: Stress Test outcomes with scenario tiles, baseline reference, and selected scenario focus
What this view shows:
Baseline tile
for normal assumptions.How the summary is calculated:
75%.Baseline tile is shown for reference but is
not included in the average stress score.How to read the tiles:
Fully funded plus Net Estate, orFunded: xx% plus the age reached.How to use it:
Baseline tile to
see how much deterioration the stress path causes.Interpretation guidance:
These scenarios are stylized planning tests, not forecasts. They were chosen to represent adverse regimes that retirement-income research repeatedly identifies as dangerous:
The scenario set is informed by retirement-income research and practitioner commentary from sources such as:
What it represents:
Why it matters:
Why it was selected:
What it represents:
Why it matters:
Why it was selected:
What it represents:
Why it matters:
Why it was selected:
What it represents:
Why it matters:
Why it was selected:
What it represents:
Why it matters:
Why it was selected:
What it represents:
Why it matters:
Why it was selected:
Practical guidance across all scenarios:
The Simulate run summarizes retirement sustainability across 500 randomized return scenarios, then surfaces key risk/opportunity patterns.
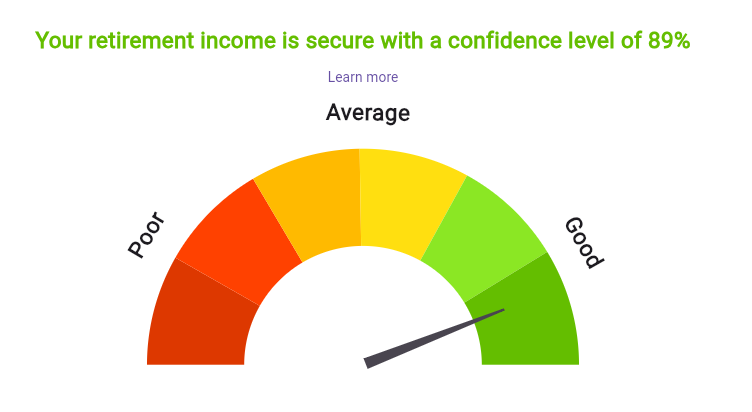
Figure 84: Simulation confidence-level gauge (success-rate summary)
What this view shows:
89%)
indicating the share of simulation paths where retirement income
remained sustainable through the plan horizon.How to read it:
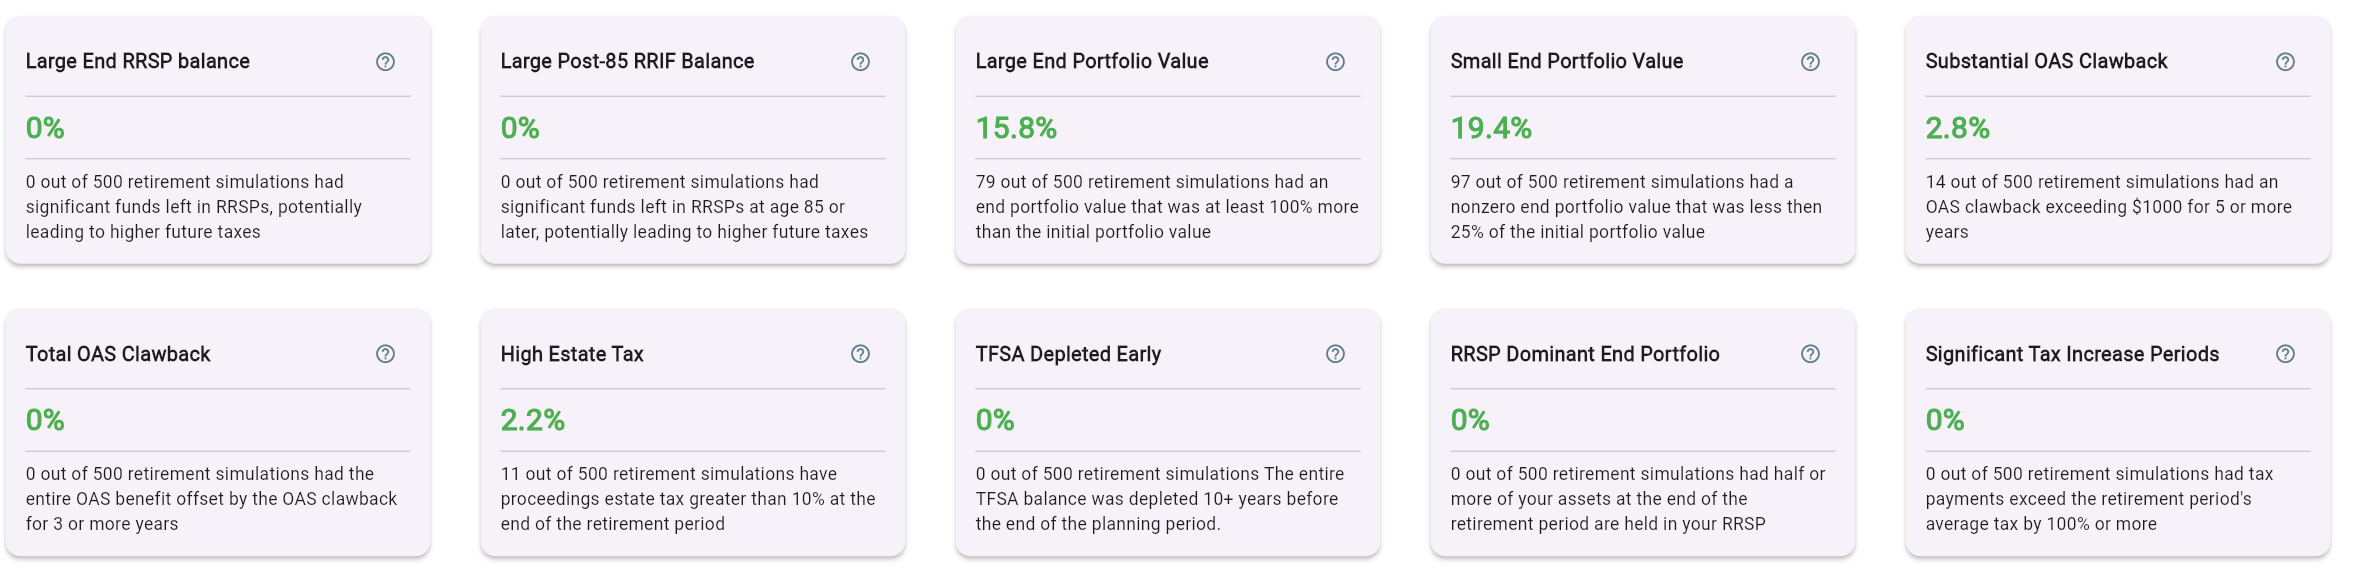
Figure 85: Simulation highlights cards (frequency of important risk and outcome patterns)
What this view shows:
Large End Portfolio ValueSmall End Portfolio ValueSubstantial OAS ClawbackHigh Estate TaxTFSA Depleted EarlyRRSP Dominant End PortfolioHow to use it:
These charts provide distribution-aware views of simulation outcomes across age, instead of a single deterministic path.
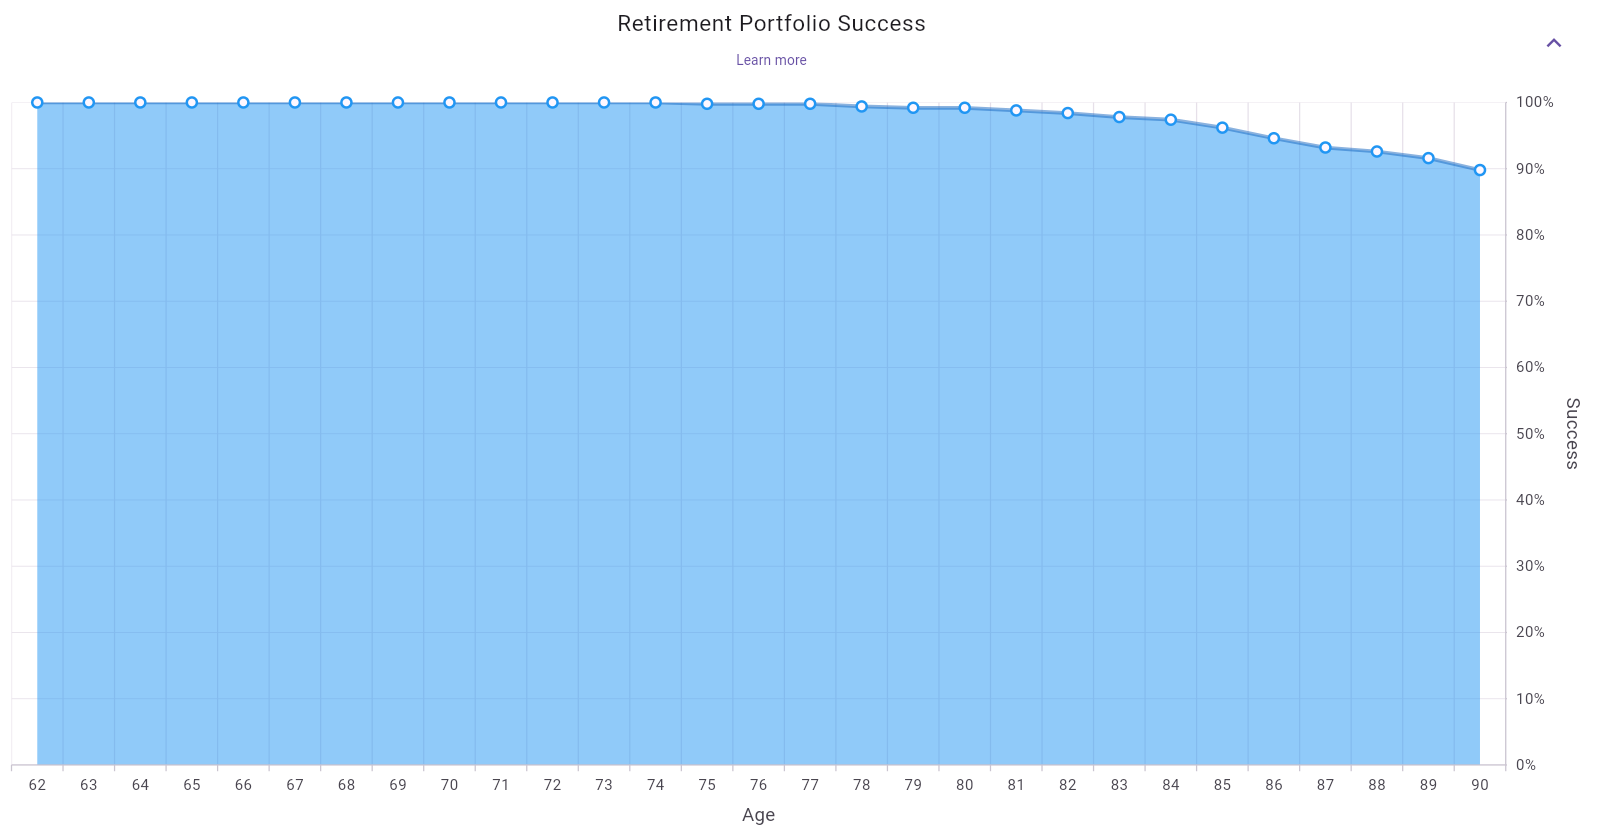
Figure 86: Retirement portfolio success curve by age under Monte Carlo simulation
What this chart shows:
How to read it:
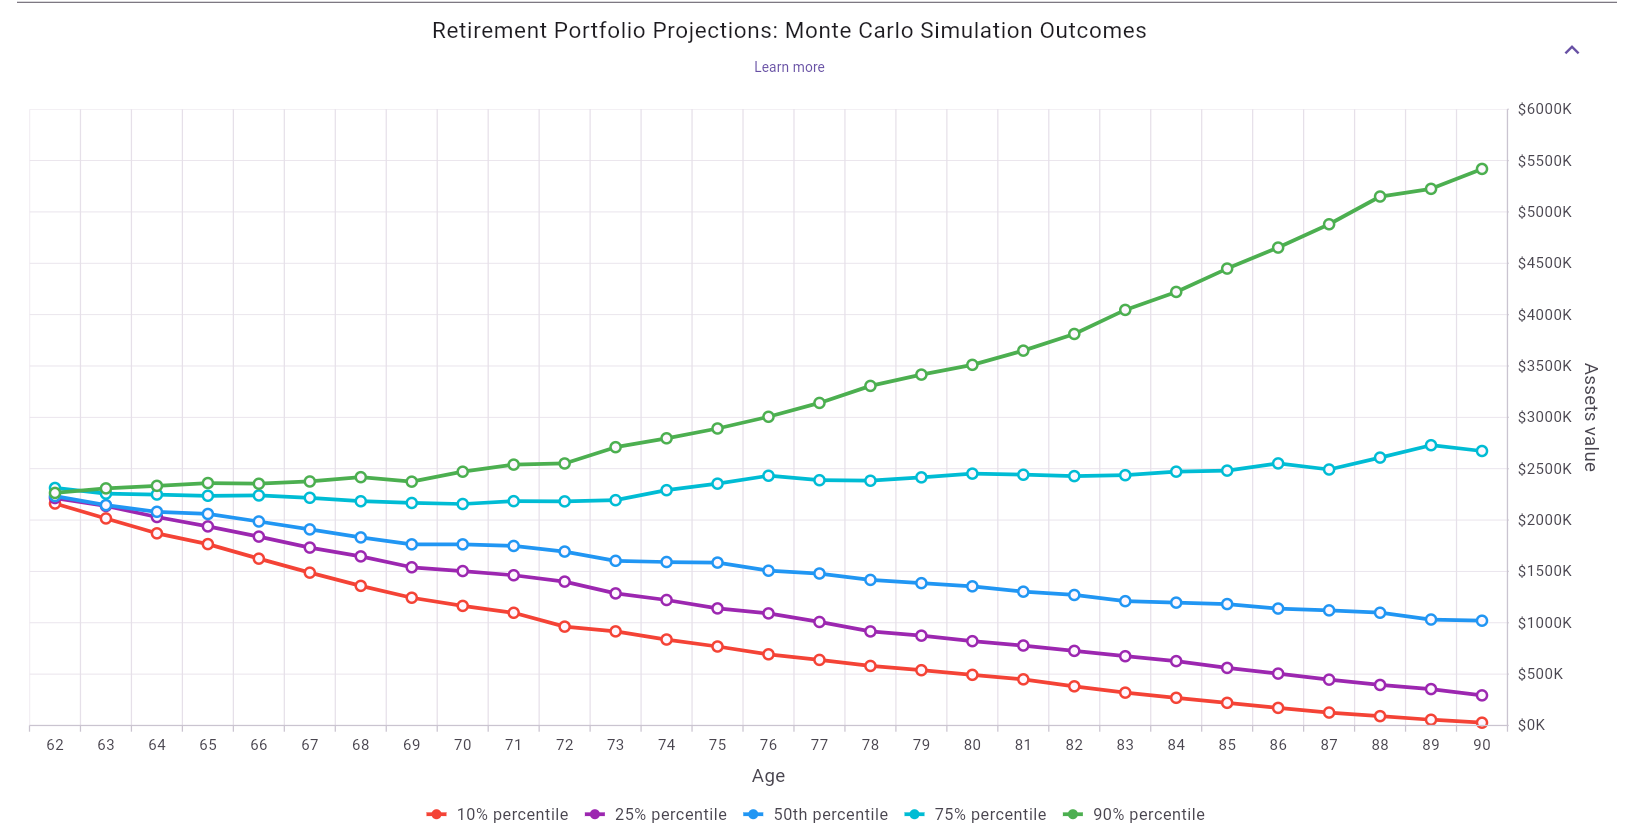
Figure 87: Monte Carlo portfolio outcomes with percentile paths (10th, 25th, 50th, 75th, 90th)
What this chart shows:
10th percentile (stress path)25th percentile50th percentile (median)75th percentile90th percentile (strong path)What “percentile” means (plain language):
10th percentile means 10% of simulations were at or
below that value (and 90% were above it).50th percentile means the median outcome: half of
simulations were below and half were above.90th percentile means only 10% of simulations were
above that value.How to read it:
This is one chart component with multiple tabs. The two views below are different tabs of the same chart:
Closing balance tabEstate tab
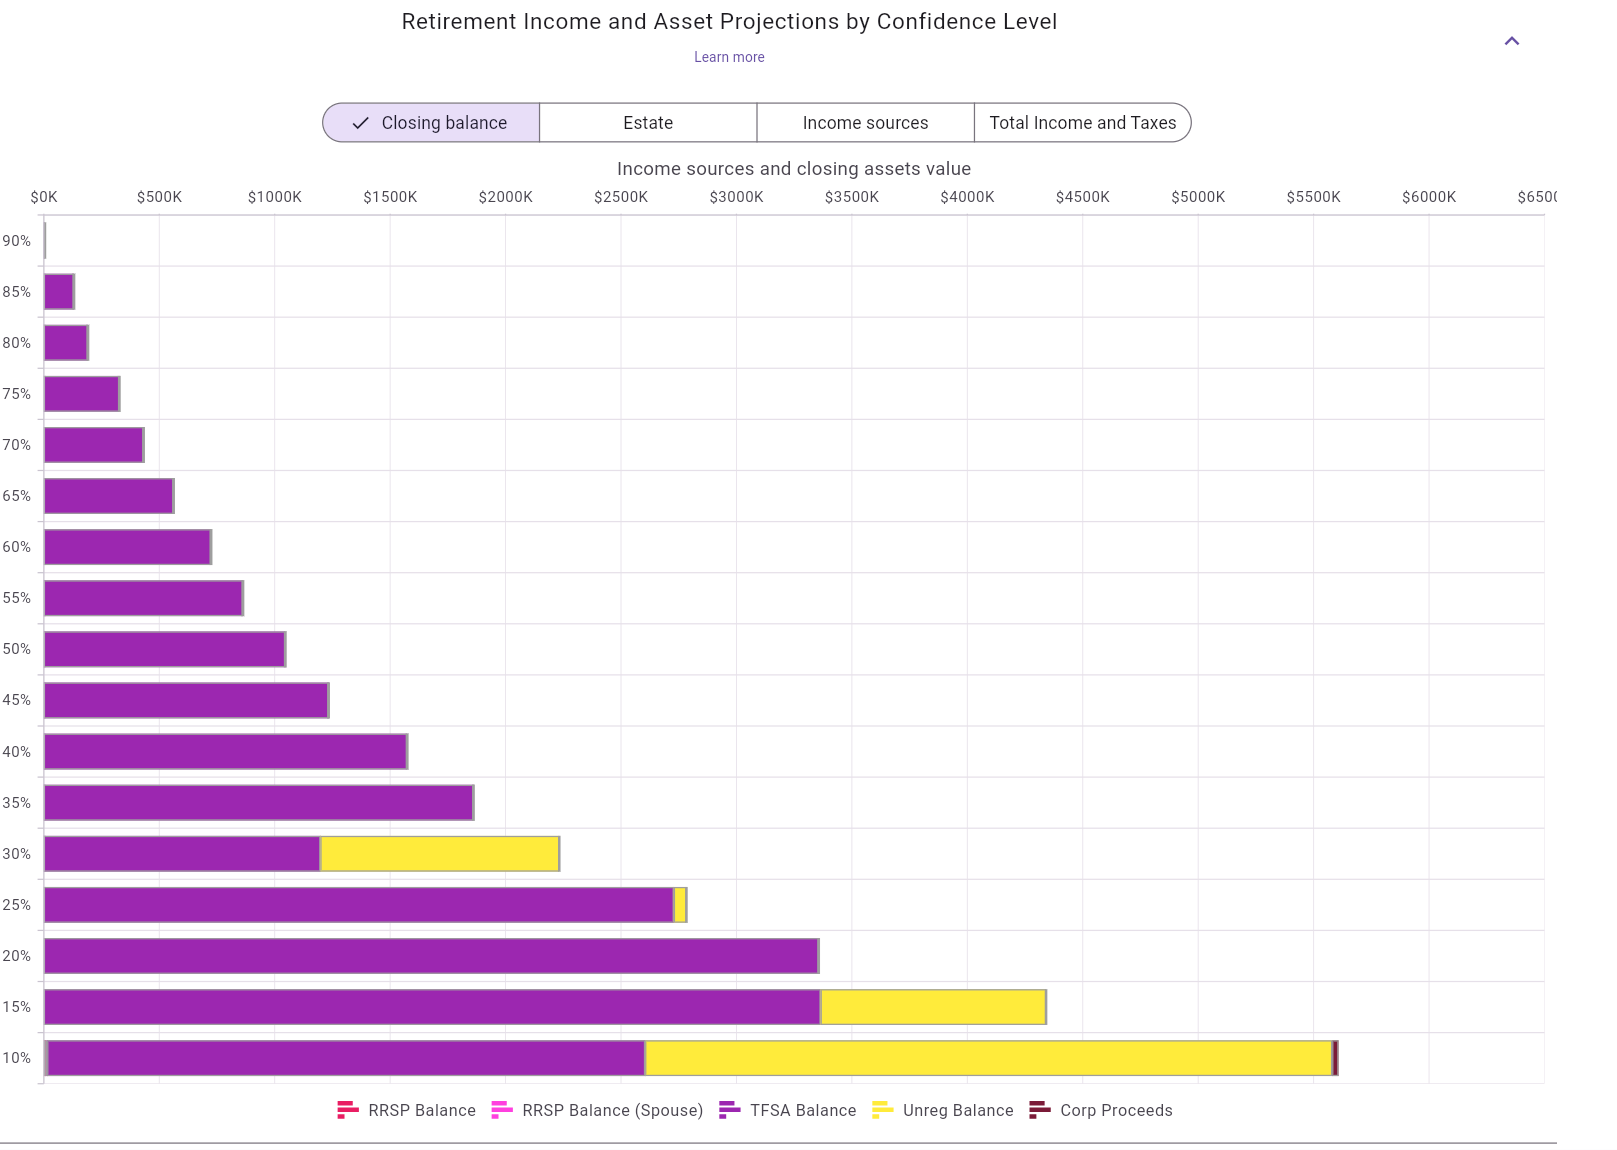
Figure 88: Confidence-level chart in Closing balance tab
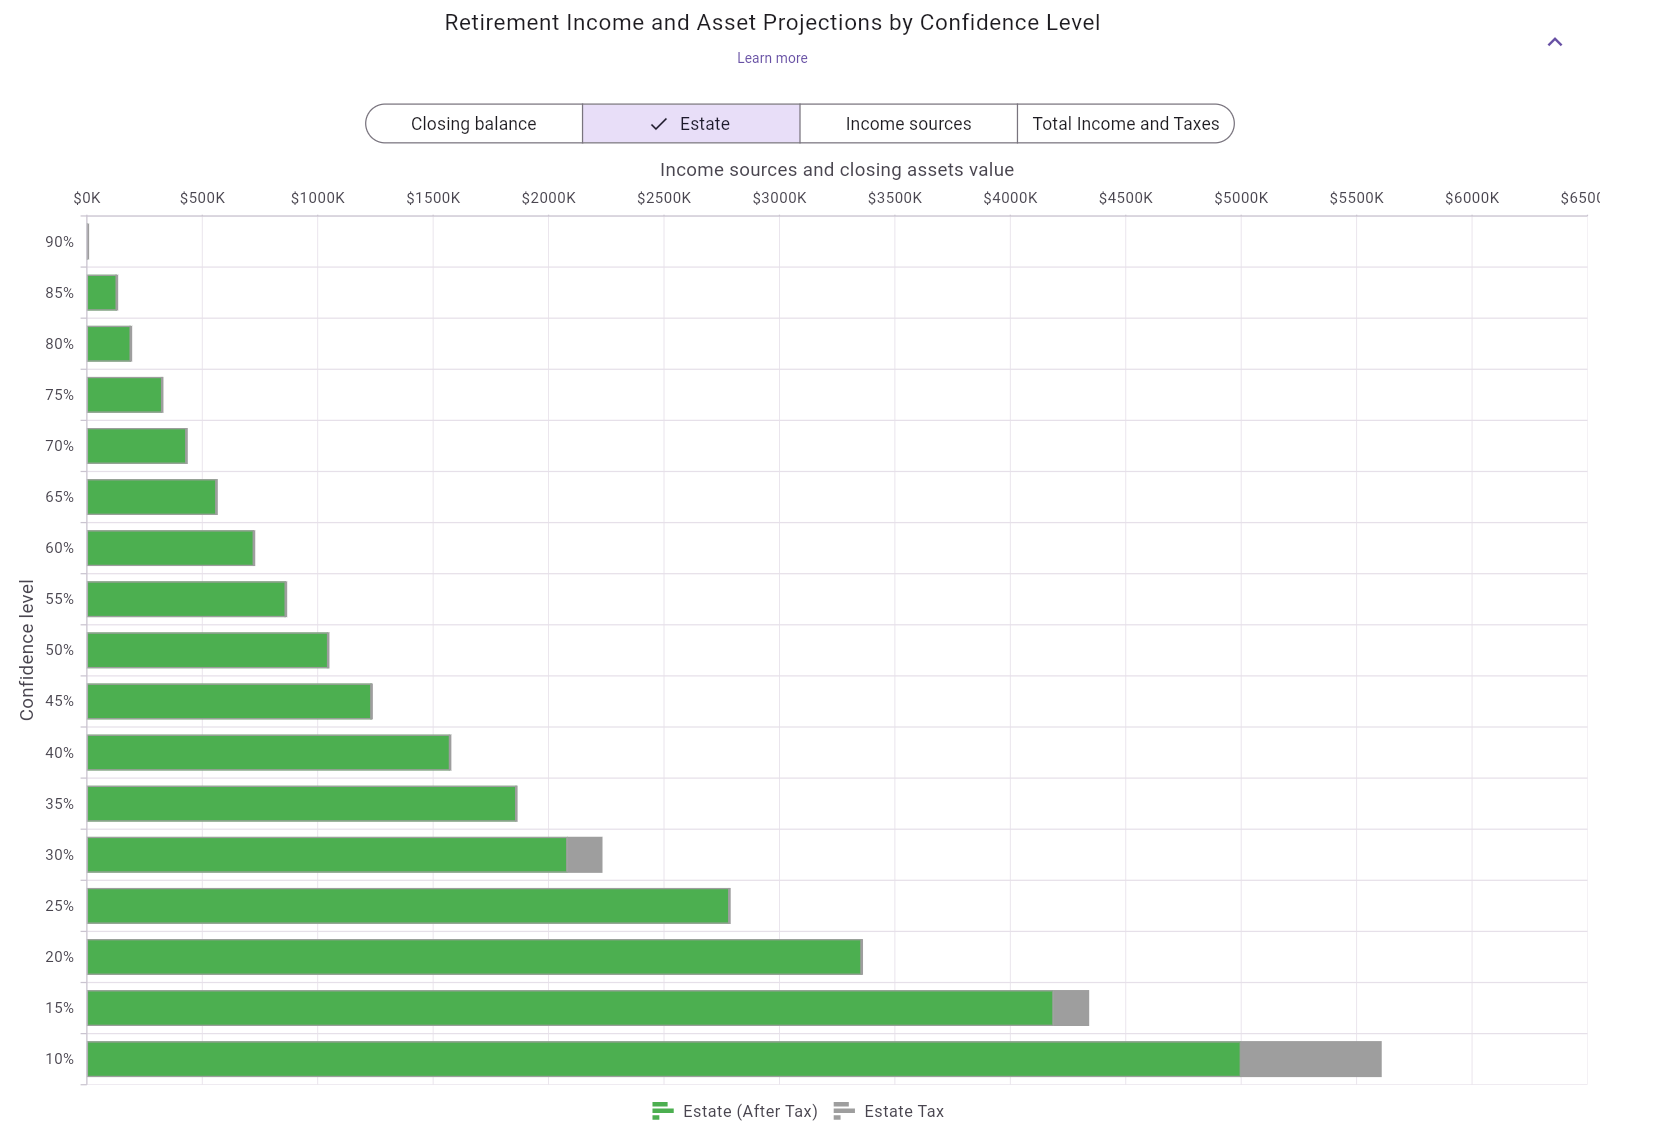
Figure 89: Confidence-level chart in Estate tab
What this chart shows:
Closing balance: closing asset mix by
account/category.Estate: after-tax estate and estate-tax
composition.How to read it:
This chart is also tabbed. The examples below show:
Inflation tabUS Equity) showing return distributions
for that asset class
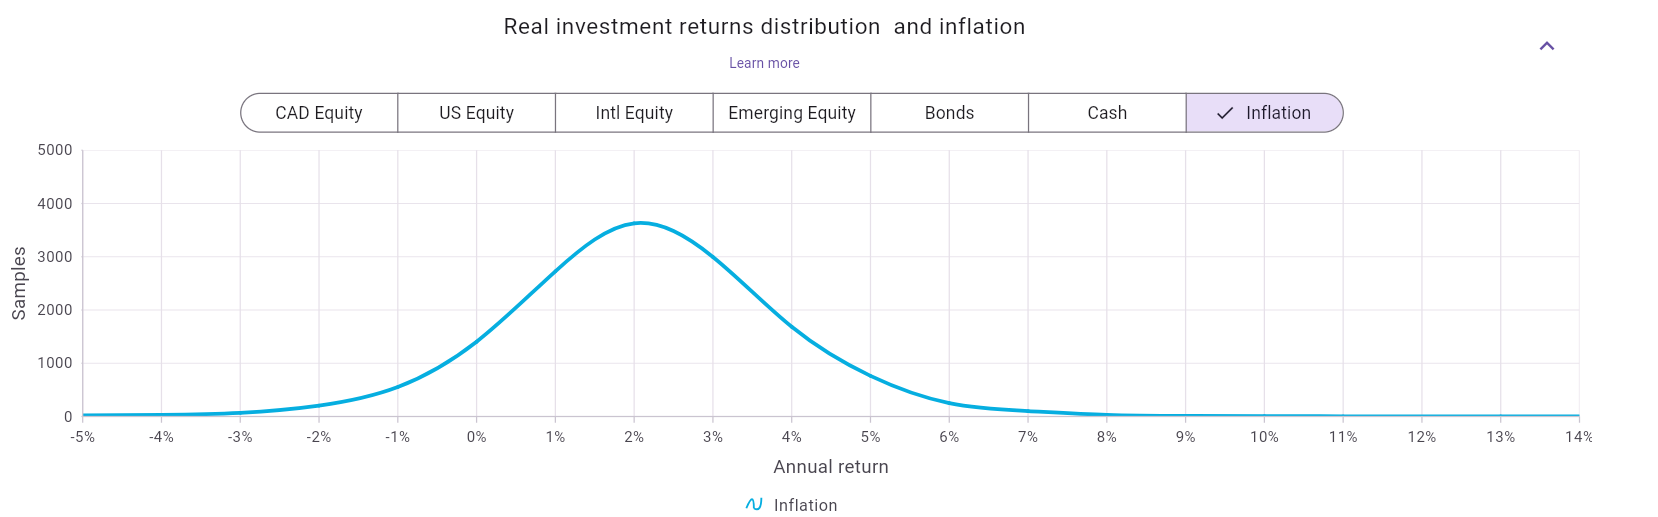
Figure 90: Real investment returns distribution chart - Inflation tab
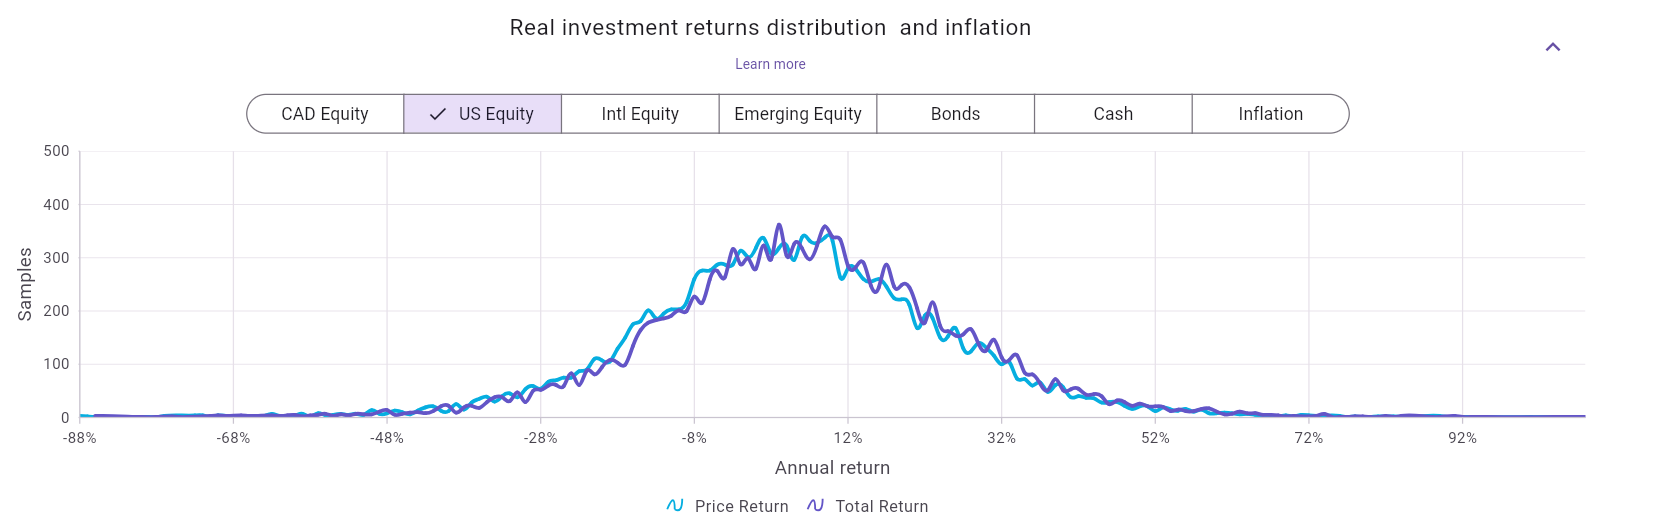
Figure 91: Real investment returns distribution chart - Asset class tab example (US Equity)
What this chart shows:
Advanced modeling note (technical/internal):
Why this matters for interpretation:
The confidence slider lets you pick a specific confidence level and immediately view one corresponding retirement outcome in the same style as Calculate (funded banner, charts, and detailed table for that selected level).
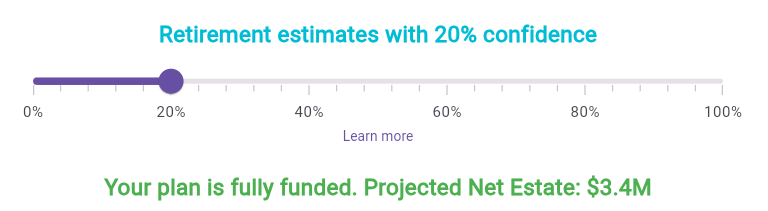
Figure 92: Confidence slider example at 20%
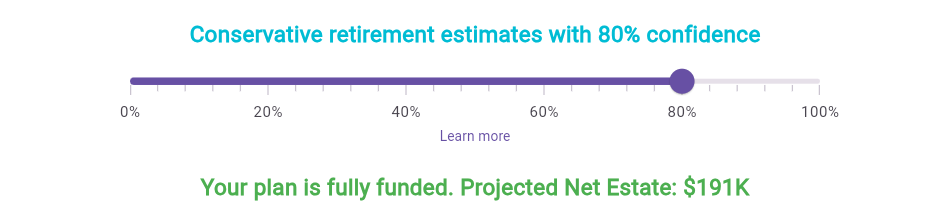
Figure 93: Confidence slider example at 80%
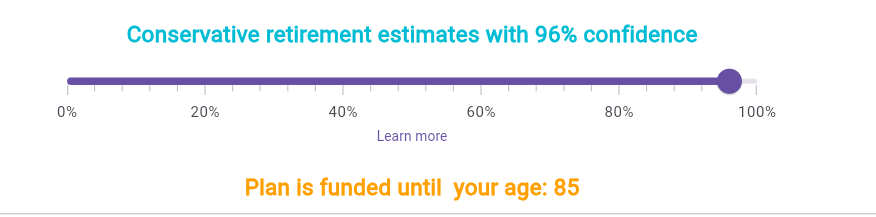
Figure 94: Confidence slider example at 96%
What “confidence level” means in this context:
How to use it:
Backtesting runs your plan through many historical return windows. The backtesting screen shows all tested periods together, highlights strongest and weakest outcomes, and lets you drill into any specific period.
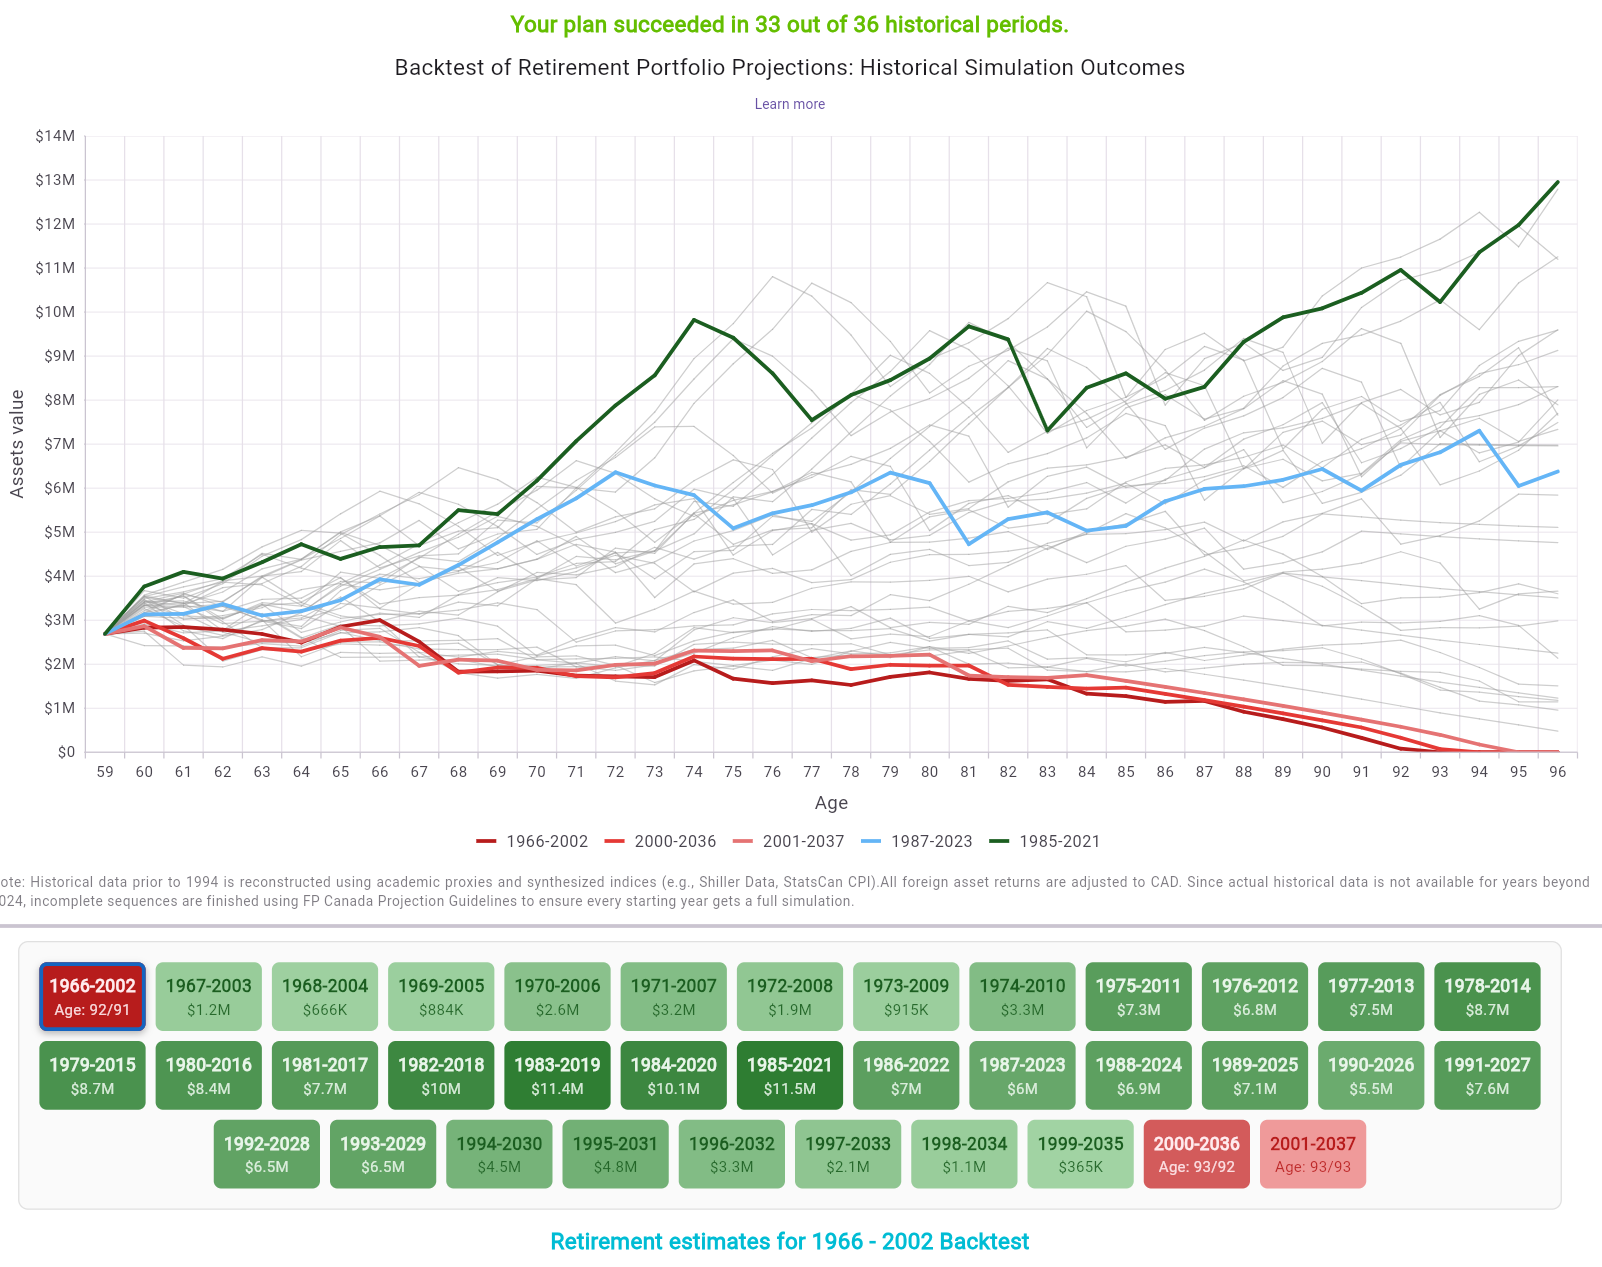
Figure 95: Backtesting outcomes with historical-period tiles and selected-sequence focus
What this view shows:
How to use it:
Interpretation guidance:
MayRetire uses a flexible withdrawal engine to meet your required retirement income while respecting your strategy settings and tax-efficiency rules.

Figure 96: Income source priority and fallback sequence
Default priority sequence:
Important interpretation note:
Thank you for reading the MayRetire tutorial.
If you have feedback, ideas, or feature suggestions, please contact
us at support@mayretire.com.
We wish you successful retirement planning with MayRetire: https://mayretire.com
Follow MayRetire for updates and tips: